
Ending of NASDAQ Win Streak ?
By TradingAnalysis September 28, 2020
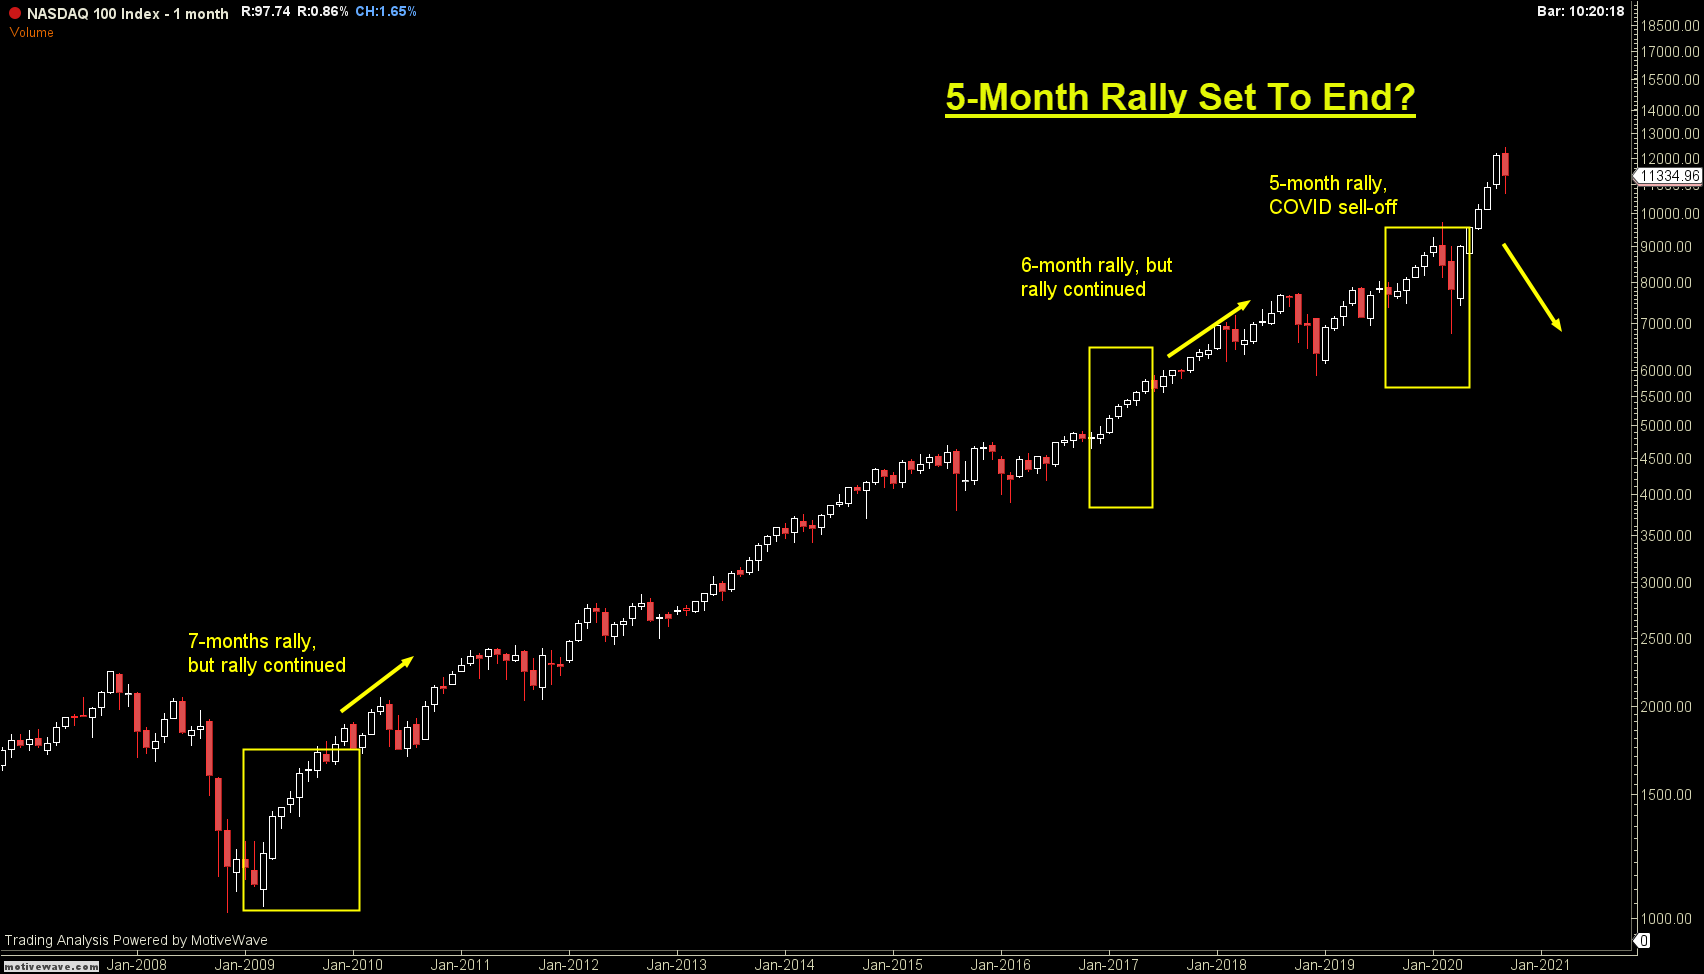
The Nasdaq 100 – We are in danger of ending a 5-month winning streak in the Nasdaq 100 (NDX), but does that sound the alarm that a deeper correction is coming? Sure, the sentiment is extremely bearish, and as Tom Lee said earlier, traders are the MOST short the Nasdaq since the March ’09 lows! However, if you consider how the NDX behaves historically following such periods of expansion, you will see a slightly different story being told. With the exception of the COVID-19 fueled decline (which ended a 5-month winning streak in the NDX), the derailment of 5-month rallies in the NDX over the last 10 years have been rather inconsequential, ultimately leading to further gains. Specifically, let’s look at the last 2 winning streaks which occurred over the last decade. One such occurrence began in November of 2016 and concluded in May of 2017. The multi-month rally ended, but we ultimately rallied another 37% before we saw any meaningful correction! Before that, it was the rally which took place off the Mach of 2009 lows… We rallied for 7 straight months, took a breather, and then rallied another 24% before a larger correction set in. See the monthly chart of the NDX below to get a better sense of the “bigger picture” at play in the markets.
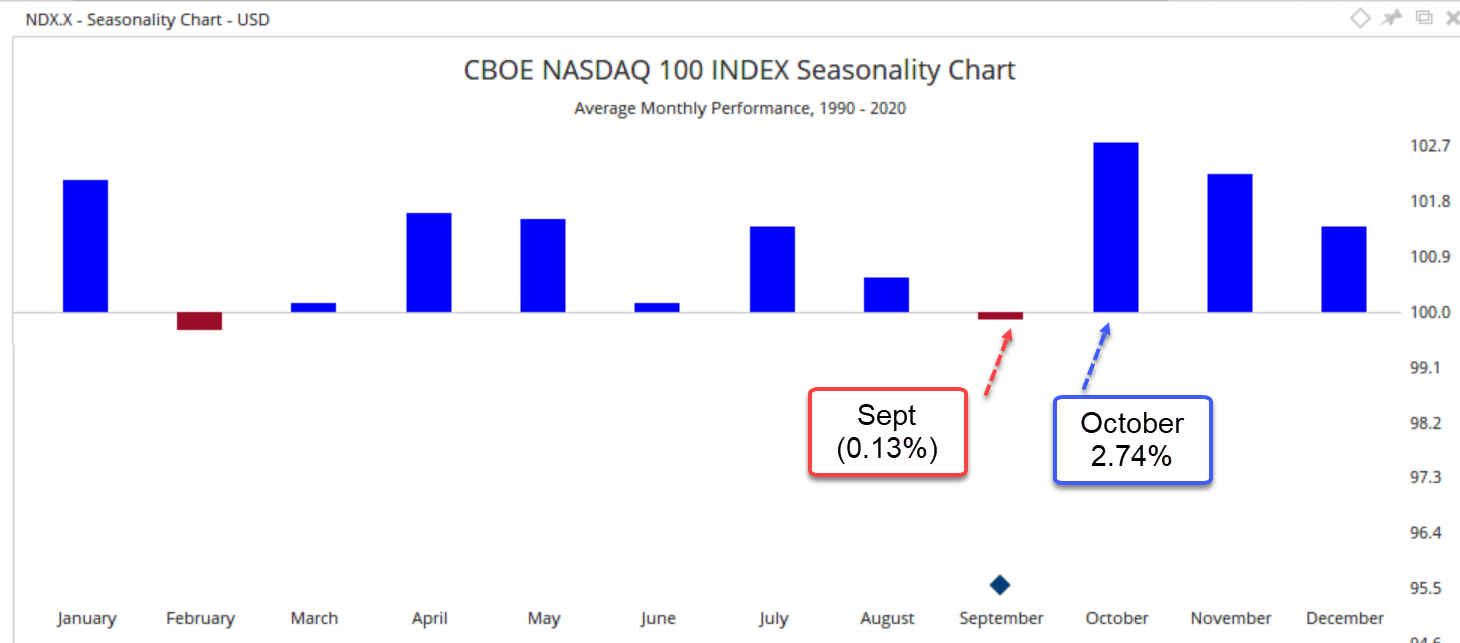
Seasonality – Next, lets review seasonality in the NDX as that helps put a negative month into context. Over the last 30 years the NDX is down an average of (0.13%) in September, but October snaps back to be the biggest month with an average gain of 2.74%! So, based on those two stats alone we continue to remain overweight tech in our portfolios. Todd Gordon, founder of TradingAnalysis.com is also overweight tech, with his current largest holdings being XLK (S&P Technology Sector), QQQ (Nasdaq 100 ETF), followed by Apple and Netflix. See the average monthly performance chart of the NDX below for more information.
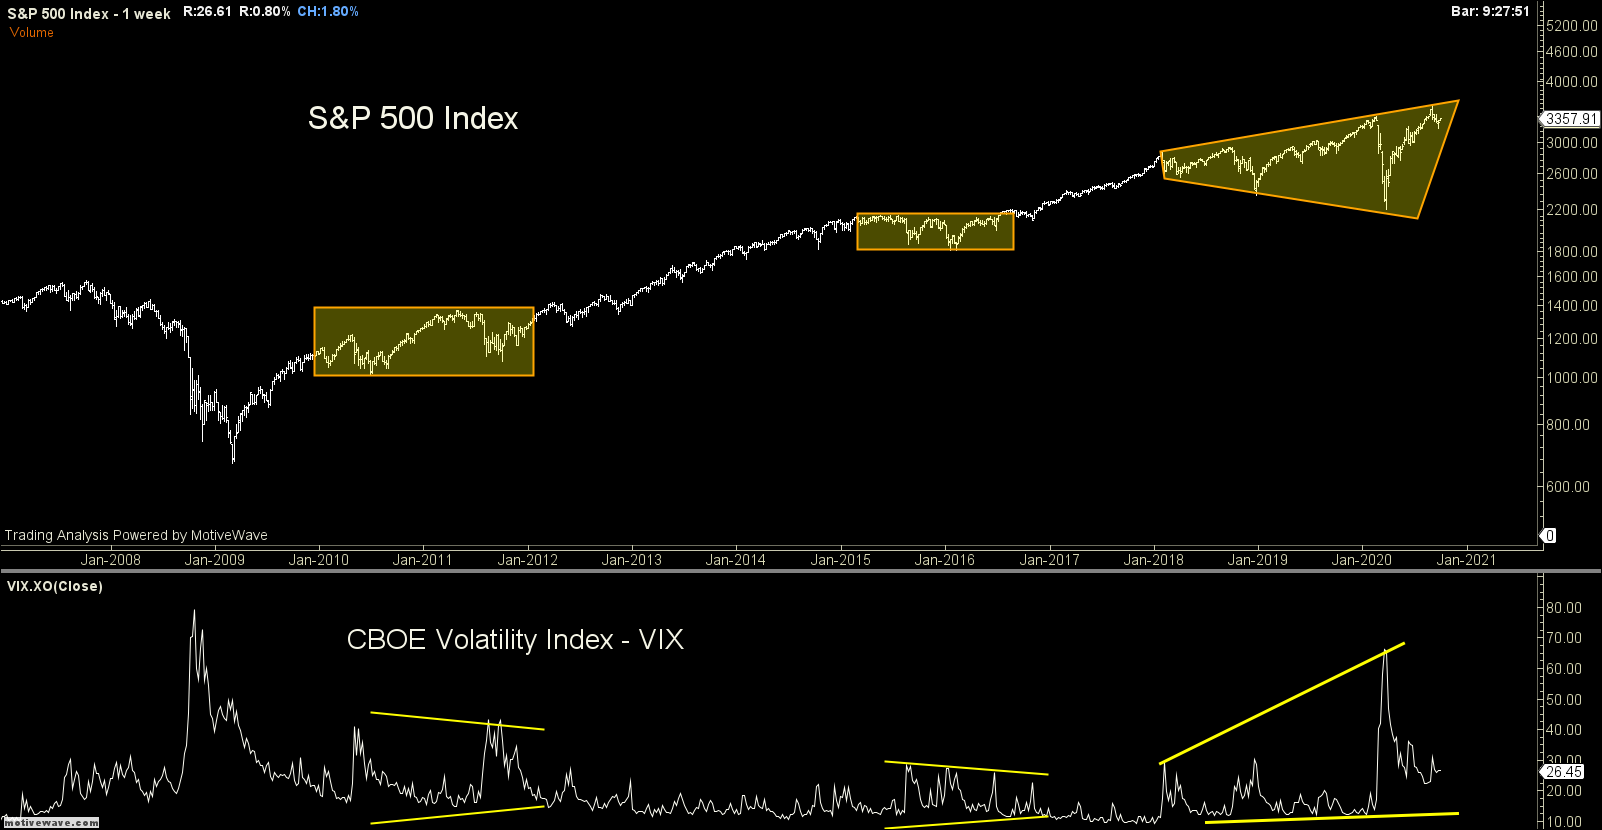
S&P 500 / VIX – It is important to keep in mind that from a technical point of view the S&P 500 is STILL in correction mode. However, this correction is unlike the prior 2 corrections that exhibited a consolidation-shaped pattern, whereas our current market correction is an expanding pattern consisting of higher-highs AND lower-lows. Looking at the VIX below you will see the volatility is expanding in this correction, while it contracted during the previous 2 corrections.
In conclusion, I would like to emphasize the importance of always considering your investment timeframe when determining how to structure your individual investment or retirement portfolios. As we approach the November elections, we could be met with a potential volatility catalyst, but in the end those of you planning for retirement 10, 20 or 30+ years down the road should be seeking to capitalize on any such corrections as opposed to impulsively fleeing your high conviction investments (which we find far too many self-directed investors doing). Moving forward, although we continue to remain overweight technology, we do plan to begin adding additional exposure in non-tech names and sectors such as the transports which continue to gain traction along with the overall economic recovery effort.
-Bennett Tindle
Chief Analyst
TradingAnalysis.com
Checkout Elliott Wave Wednesday @ 8:45am EST
Awesome website man, looks very nice. Ive been looking for something like this.