
Trading Into New Highs?!
Bennett Tindle, September 1st, 2020
New High.
Can you believe the S&P 500 is now over 3% ABOVE February highs? Yes, you read that right, we have now essentially erased the recent decline and are continuing to print new highs in the S&P 500… At the same time, the Nasdaq 100 is now over 25% above its February high! If you have been sitting in cash, you have missed out on one of the most incredible recovery efforts in the history of financial markets. So the question is, how did we get here?
As you know, here at TradingAnalysis.com we have been extremely bullish on the technology and communication sectors. We sat patiently exposed through the Feb-March correction, hedging and capitalizing on the decline, yet we remained optimistic and held firm to our conviction that new highs were just around the corner. Now that our outlook is in play, we must take a step back and evaluate the market, and more specifically the sectors and industry groups that are outperforming the benchmark. There is no question we find ourselves in a different trading environment, and as traders and investors it is our job to adapt as those changes materialize.
When the COVID-19 fueled decline got underway, a clear trend began to emerge as social distancing guidelines were enacted. Companies started moving away from traditional practices and transitioning into a work-from-home business model. This change, which was driven by external forces (COVID-19 restrictions), rapidly expedited any plans companies previously had in place to further develop remote workforce opportunities. In fact, based on a recent survey, that shift was expedited by an average of 6 years! Taking this into consideration, and it is no surprise we find the Technology and Communication sectors trading well above pre COVID-19 levels!
Now, back to the bit about adapting as new trends emerge… Allow me to elaborate.
Part of becoming a profitable and successful trader or investor is learning discipline. Far too many new traders are eager to trade and feel as if they must always be in the market… Yet ask any seasoned trader, and they will tell you in order to be successful in financial markets, you must master the art of sitting on your hands! Again, you heard that right. And as seasoned traders, we know that awaiting high conviction setups is the preferred strategy and is not only generally more profitable, but also much less stressful than throwing darts blindly at multiple targets. Every now and again however, we come across conditions in the markets that force us to adapt and change our way of thinking. That time is now!
If you review a chart of the S&P 500 or Nasdaq 100, you will notice every single corrective pullback in this market following the March lows has been a buying opportunity in the eyes of bulls. If one were to try and be disciplined, awaiting the traditional textbook entries you have become accustomed to, you would have nothing to show for the last 6 months. We get it, it is not easy learning to be ‘OK’ with buying or trading into new highs with technically overbought conditions! We have all been there, but remember this… Markets are dynamic, and in order to grow you must evolve with the markets and the opportunities they present! As you will see below, we have done just that!
We know taking positions into these levels can be hard to stomach, so allow us to leave you with a few examples to help motivate and potentially catalyze your evolution as a trader or investor! Over the course of the last few weeks, we have been successfully trading into new highs in multiple stocks, including Nvidia, AMD and Visa. Allow me to walk you through two of those trades.
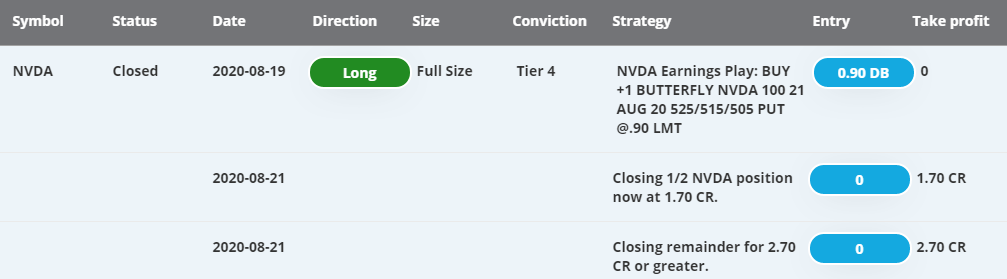
On August 19th we identified a bullish setup in semiconductor manufacture Nvidia, positioning ourselves and our members for a move into $515 a share by August 21st expiration. We picked up a 525/515/505 PUT butterfly for a net debit of 0.90, of $90 per fly. Two days later we started scaling out of the position at $1.70, followed by our final exit at $2.70, or 88% and 200% respectively.
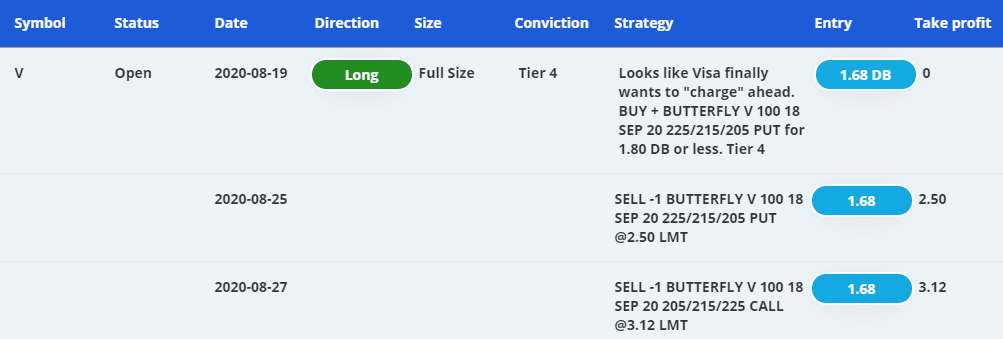
Also on August 19th, after nearly two months of consolidation, we identified a breakout setting up in the stock of Visa. Our analysis suggested we were gearing up and ready to “charge” ahead towards $215 per share. We established a long position using a 225/215/205 PUT butterfly, for a net debit of $1.68 or $168 per fly. On August 25th, we took our first half sized position exit for $2.50 or $250 per fly, with our second exit on August 27th at $3.12, or $320. We have now recouped our cost basis as well as an overall profit on the trade and are now riding the remainder of our position into or closer to expiration. Essentially the market paid US to hold a ¼ size position into our primary price target!
We plan to continue to chip away at the long side of this market until we are presented with a valid and compelling reason to go against it. Counter-trend trading can be fun, and highly rewarding, but we would suggest you do so cautiously in this market. A large portion of the record levels of cash that sat idle on the sidelines during our summer trading months is now being reallocated as we gain clarity on the COVID front, as well as corporate earnings. Yes, a significant portion of the S&P 500 is in fact negative YTD, and many industry groups will continue to suffer as the economy struggles to recover. However, as you can see based on our trades above, if you are employing proven and sound risk management practices, you can in fact trade successfully into fresh market highs!
Evolve, adapt, execute! When the correction comes, you will be that much more prepared for it.
Elliott Wave Wednesday Show!!
Join Todd Gordon and the TradingAnalysis Team for the latest market commentary, forecasts, and trade setups of the week. These packed 60-minute sessions are filled with critical market updates, trading set ups, guest industry experts, and most importantly weekly takeaways.
Is ist possible to get an Elliott count for the $Dax?
Thank you very much.
Judging by the move in NVDA today, maybe holding on to your position or just employing calls is the more appropriate strategy. Of course, not only NVDA, but a whole host of tech companies are making very strong moves. The question is, how much further before a correction (a must needed correction in my humble opinion). Thanks for the info!