Catching a Huge Options Trade – How Surfing Elliott Waves Can Land You The Big One
2-Hour Course


Download Slides From The Presentation

Live Trading Sessions


IV Percentile and ATR Indicators

Code to put in program
IV Percentile On Chart# beginning of code ———————- –
# IV% thinkscript code
# Display Implied Volatility Percentile as a label on a chart
declare upper ;
input length = 252 ; # bars to use in implied volatility calculation
# If IV data doesn’t exist for a particular period, set it to previous value so it won’t affect the hi/low
def ivClean = if IsNaN(imp_volatility()) then ivClean from 1 bar ago
else imp_volatility() ;
def ivHi = Highest(ivClean, length) ; # highest IV over range
def ivLo = Lowest(ivClean, length) ; # lowest IV over range
def ivRange = ivHi – ivLo ; # IV range from low to high
def ivp = Round( 100 * (imp_volatility() – ivLo) / ivRange, 1) ; # IV percentile
# Define a color level from 0 to 255 based on current IV%
def level = ivp * 2.55;
input brightness = 100 ; # overall brightness of IV display
# Check bounds and convert brightness input to an intensity factor between 0.2 and 1.0
def intensity = if brightness < 0 then 0.2 else if brightness > 100 then 1.0
else 0.2 + (brightness * 0.008) ;
# Calculate red and green color levels (modified by intensity) for the color function
def rLvl = intensity * (255 – level) ;
def gLvl = intensity * (level) ;
AddLabel(yes, “IV%: ” + ivp, CreateColor(rLvl, gLvl, 0)) ;
# end of code ——————————-
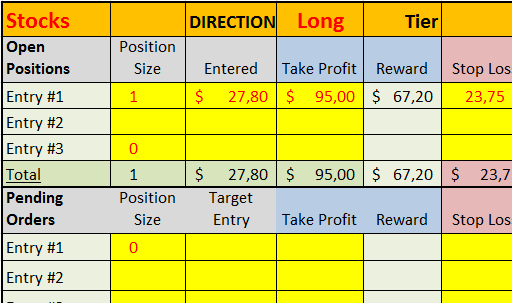
ART of the Trade – Position Calculator
Email questions or feedback to info@tradinganalysis.com.