Changing of The Guard
By Bennett Tindle July 29th, 2022
We are seeing some big changes in the markets, and the quote ‘Changing of the Guard’ looks to already be underway…
I was expecting to see one more move lower before it began, but that just hasn’t happened…
So while this could still be a larger corrective rally, it seems to be setting up for upside continuation into the remainder of Q3…
Follow me on a journey below as we look at the correlation between the 10yr yield, the Nasdaq 100 and BTC.
If you prefer our video format, scroll to the bottom of the blog to tune in now.
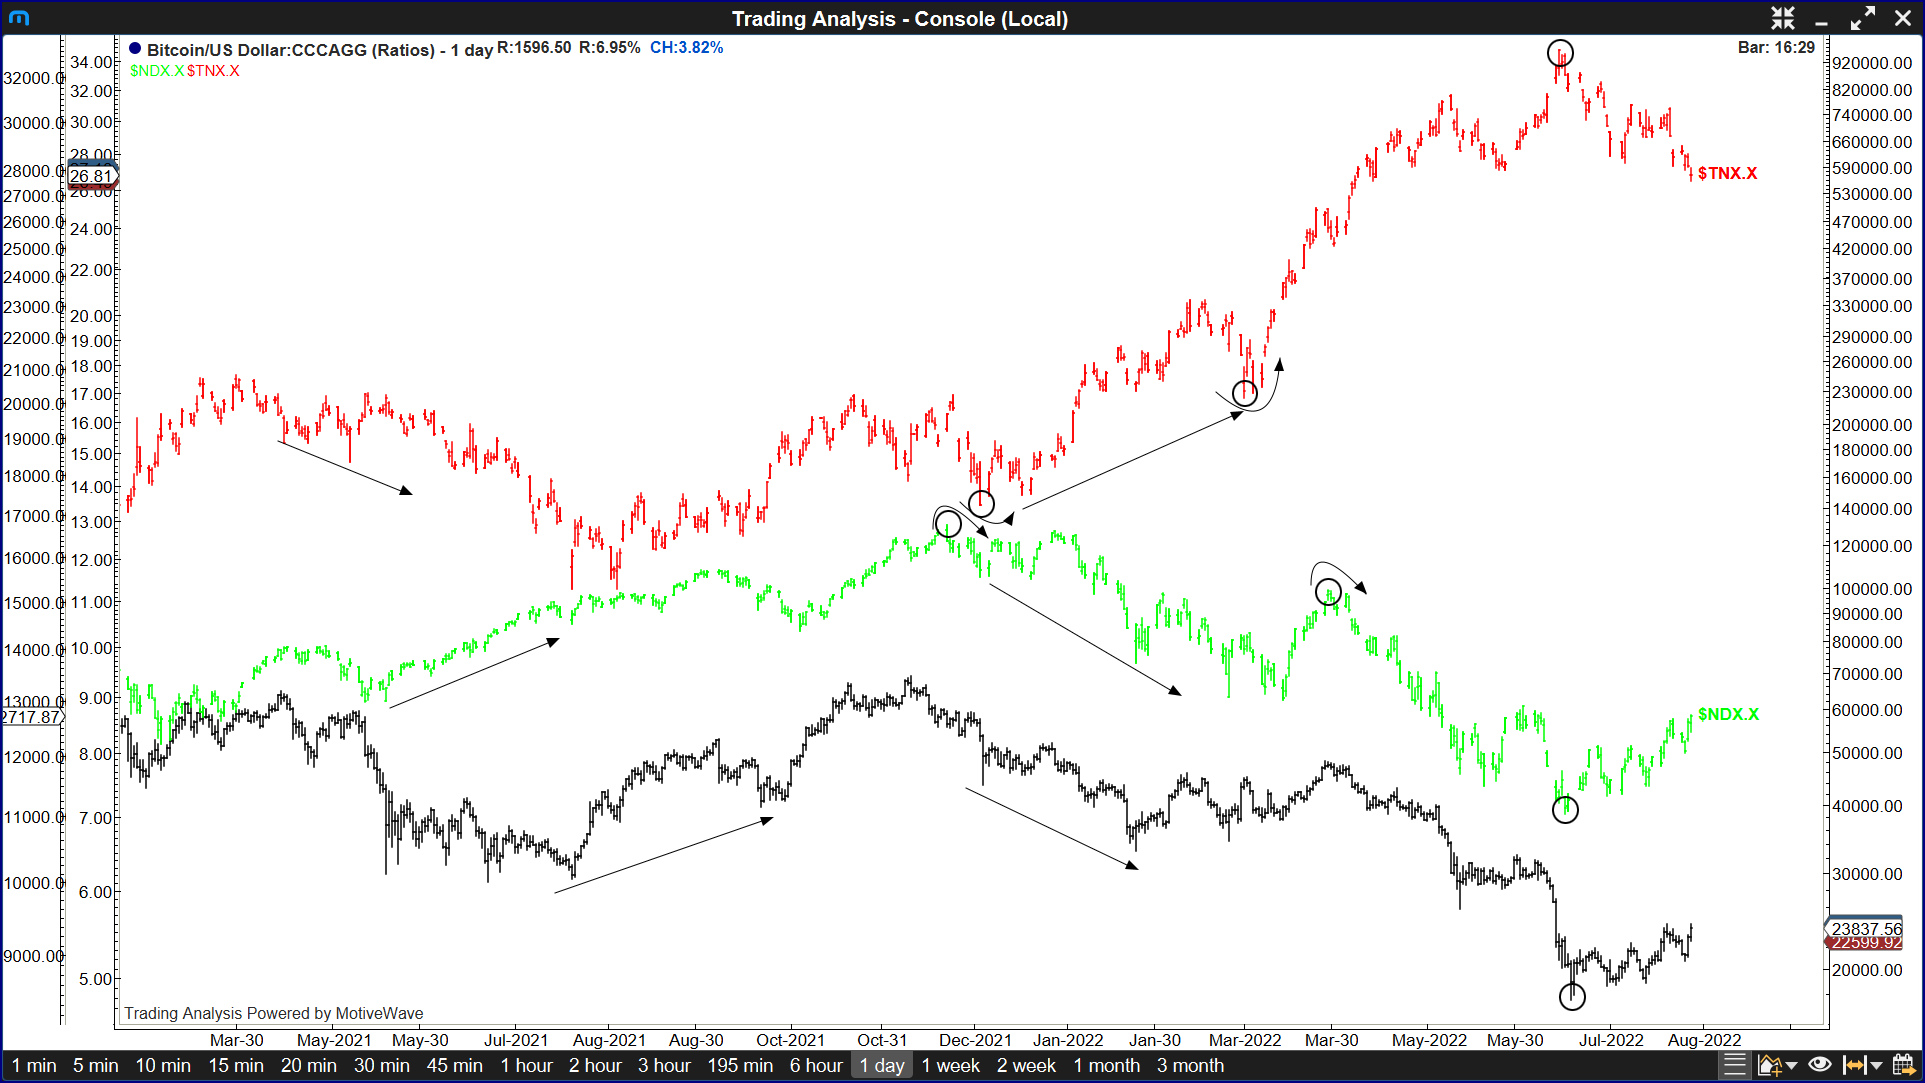
Chart Guide: Red = US10yr Yield | Green = Nasdaq 100 | Black = BTC.
In the chart above you can see the clear inverse correlation between Treasury Yields (in this case the 10yr yield), and Growth assets.
Some of the key turning points along the way include the November 2021 high in the Nasdaq, and the December 2021 low in the 10yr yield.
Since then the 10yr yield has moved higher from 1.34% to as high as 3.49% in June.
During the same period the Nasdaq 100 declined over -34%.
More recently however the 10yr Yield met technical resistance and turned lower, just as the Nasdaq 100 and BTC were finding a low.
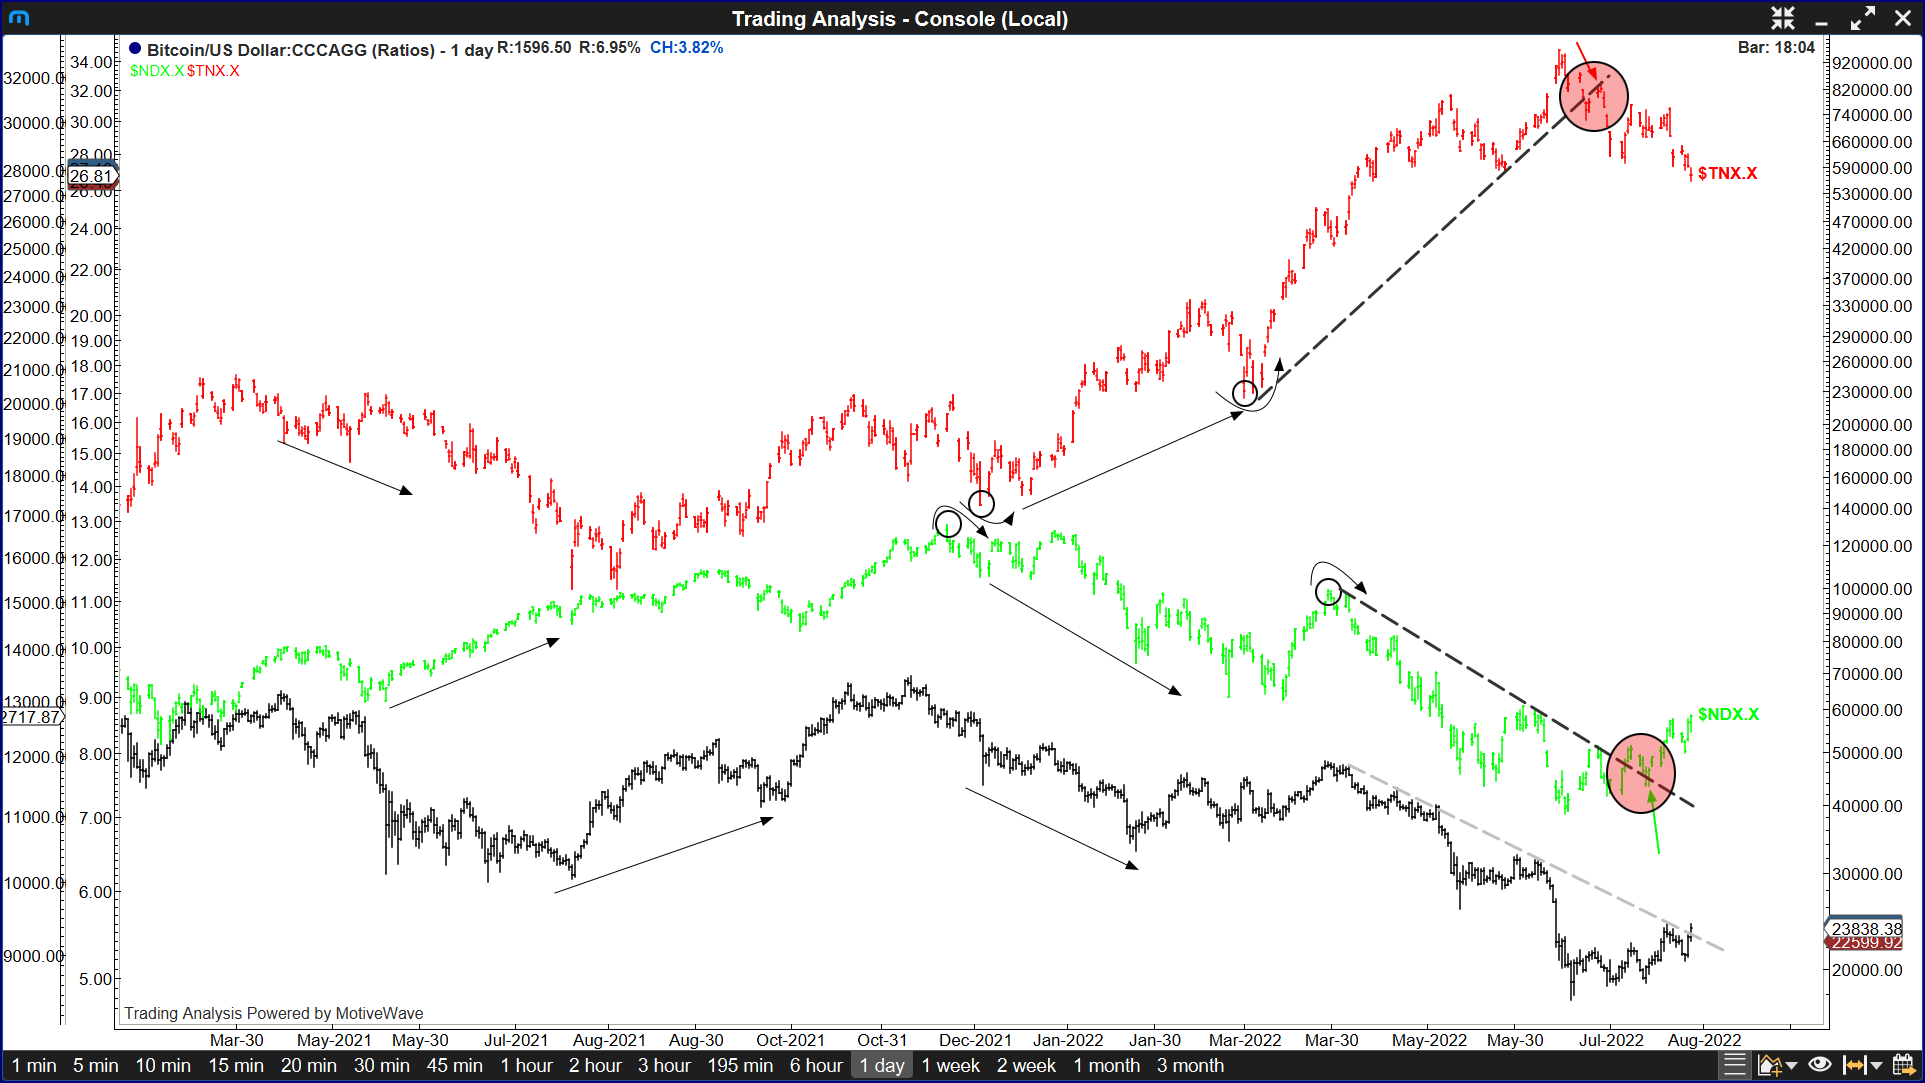
Clear technical developments and trendline breaks have followed in both the 10yr and growth assets, as seen in the next chart.
Looking to the chart above, we can see a key trendline rejection for the 10yr yield in the top right corner which occurred on June 27th.
Meaning the 10yr yield just turned its March – May trendline into resistance.
Then in the bottom right corner of the chart, we see the NDX successfully break above its March – June trendline resistance, turning it into support.
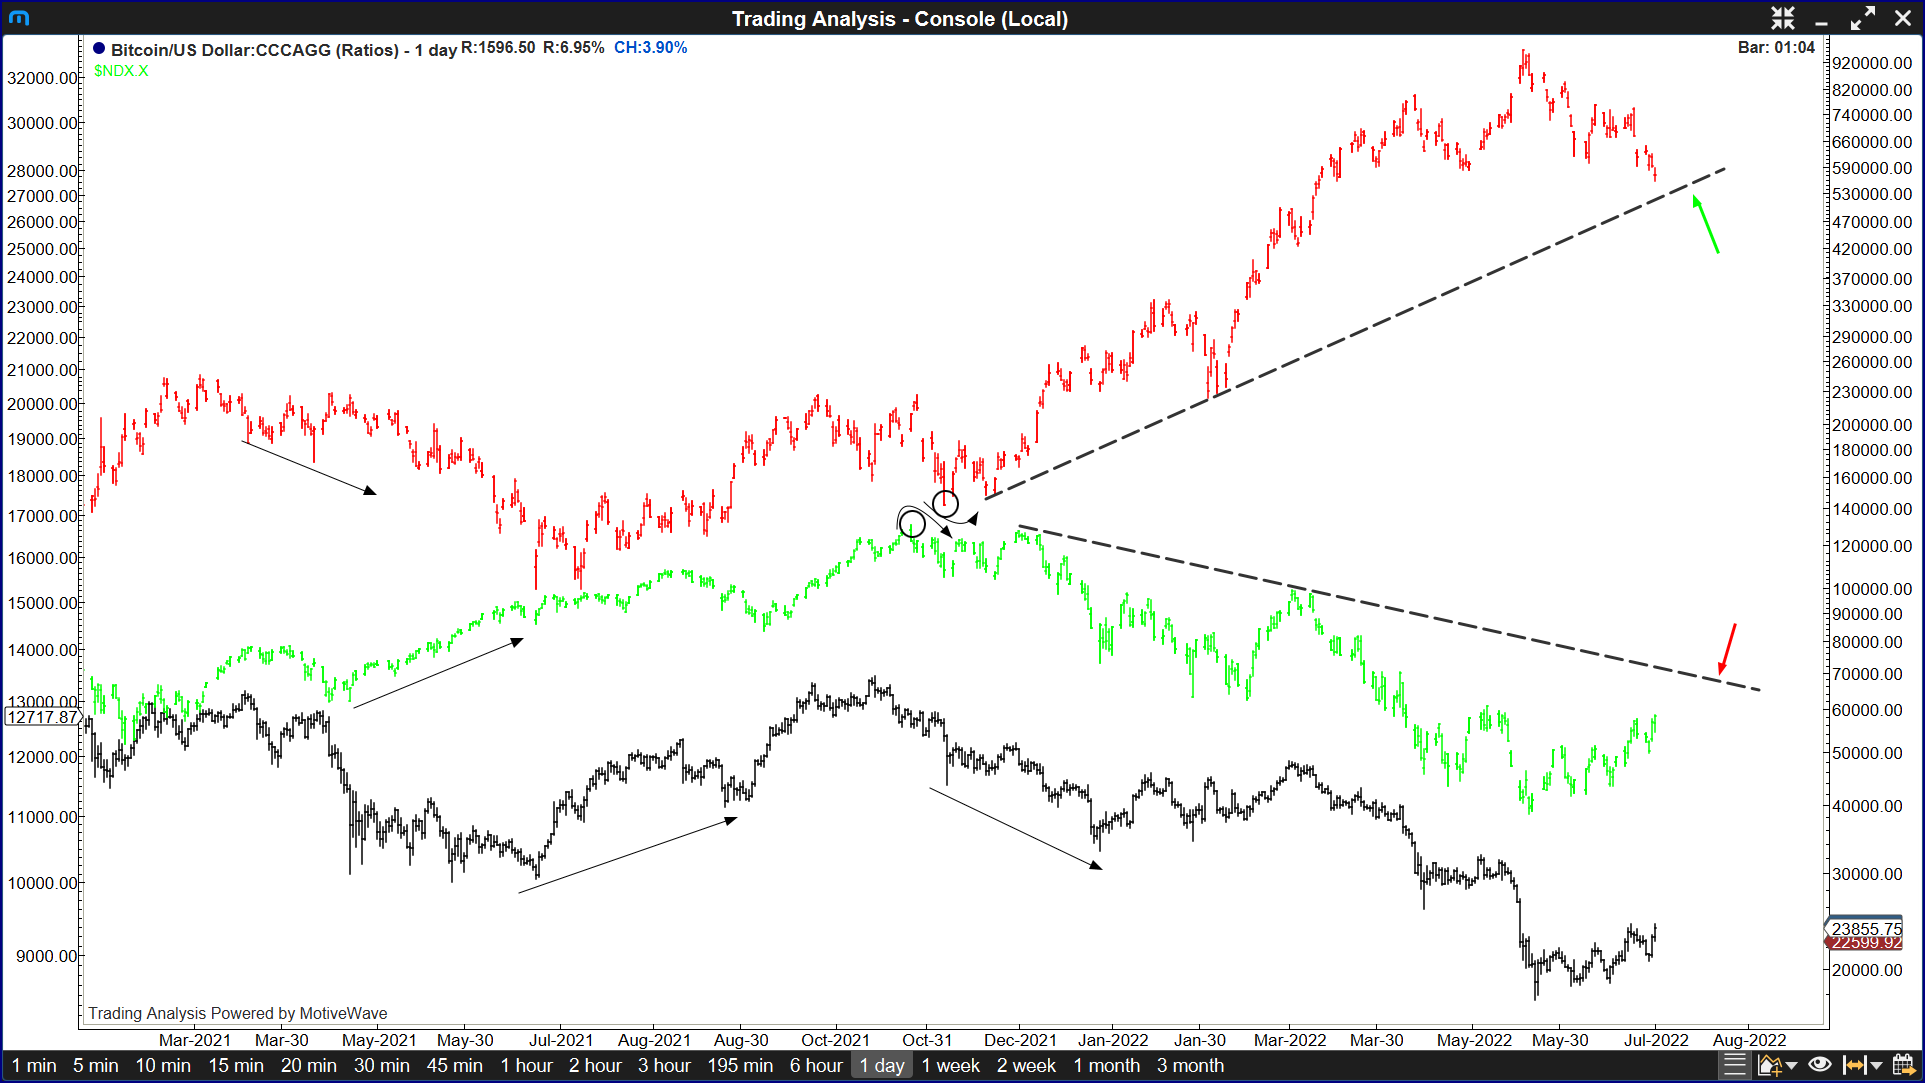
This now opens up a continuation range for both charts, which can be seen below.
This means the ‘Changing of The Guard‘ is likely already underway, and we now need to continue looking higher in the Nasdaq 100, and lower in the 10yr yield.
In addition to Fibonacci retracement levels which we will discuss in the video update, we should also be watching the next trendlines of significance.
In the case of the 10yr yield, it’s the December 2021 – March 2022 uptrend line.
In the case of the Nasdaq 100, it’s the December 2021 – March 2022 downtrend line.
What About The Rotation?
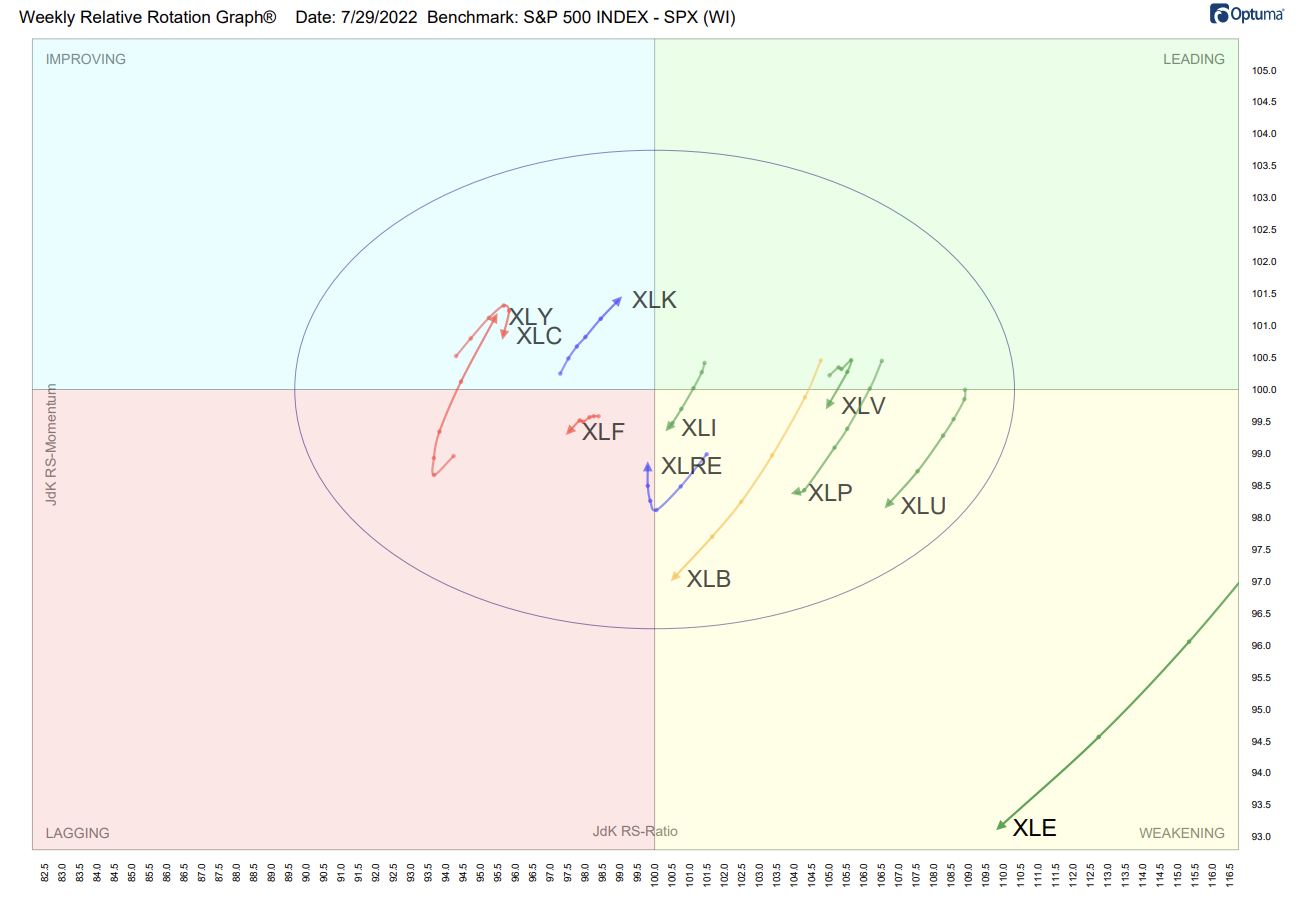
In the RRG chart above, we can see a visual representation of sector strength and momentum, relative to the S&P 500 as our benchmark.
This represents 6 weeks worth of rotations, with Discretionary and Technology moving to the North and East from Lagging and Improving towards the Leading quadrant. This indicates improving relative strength and momentum.
Simultaneously we are seeing Value sectors moving South and West from Leading and Weakening towards the Lagging quadrant. This indicates decreasing relative strength and momentum.
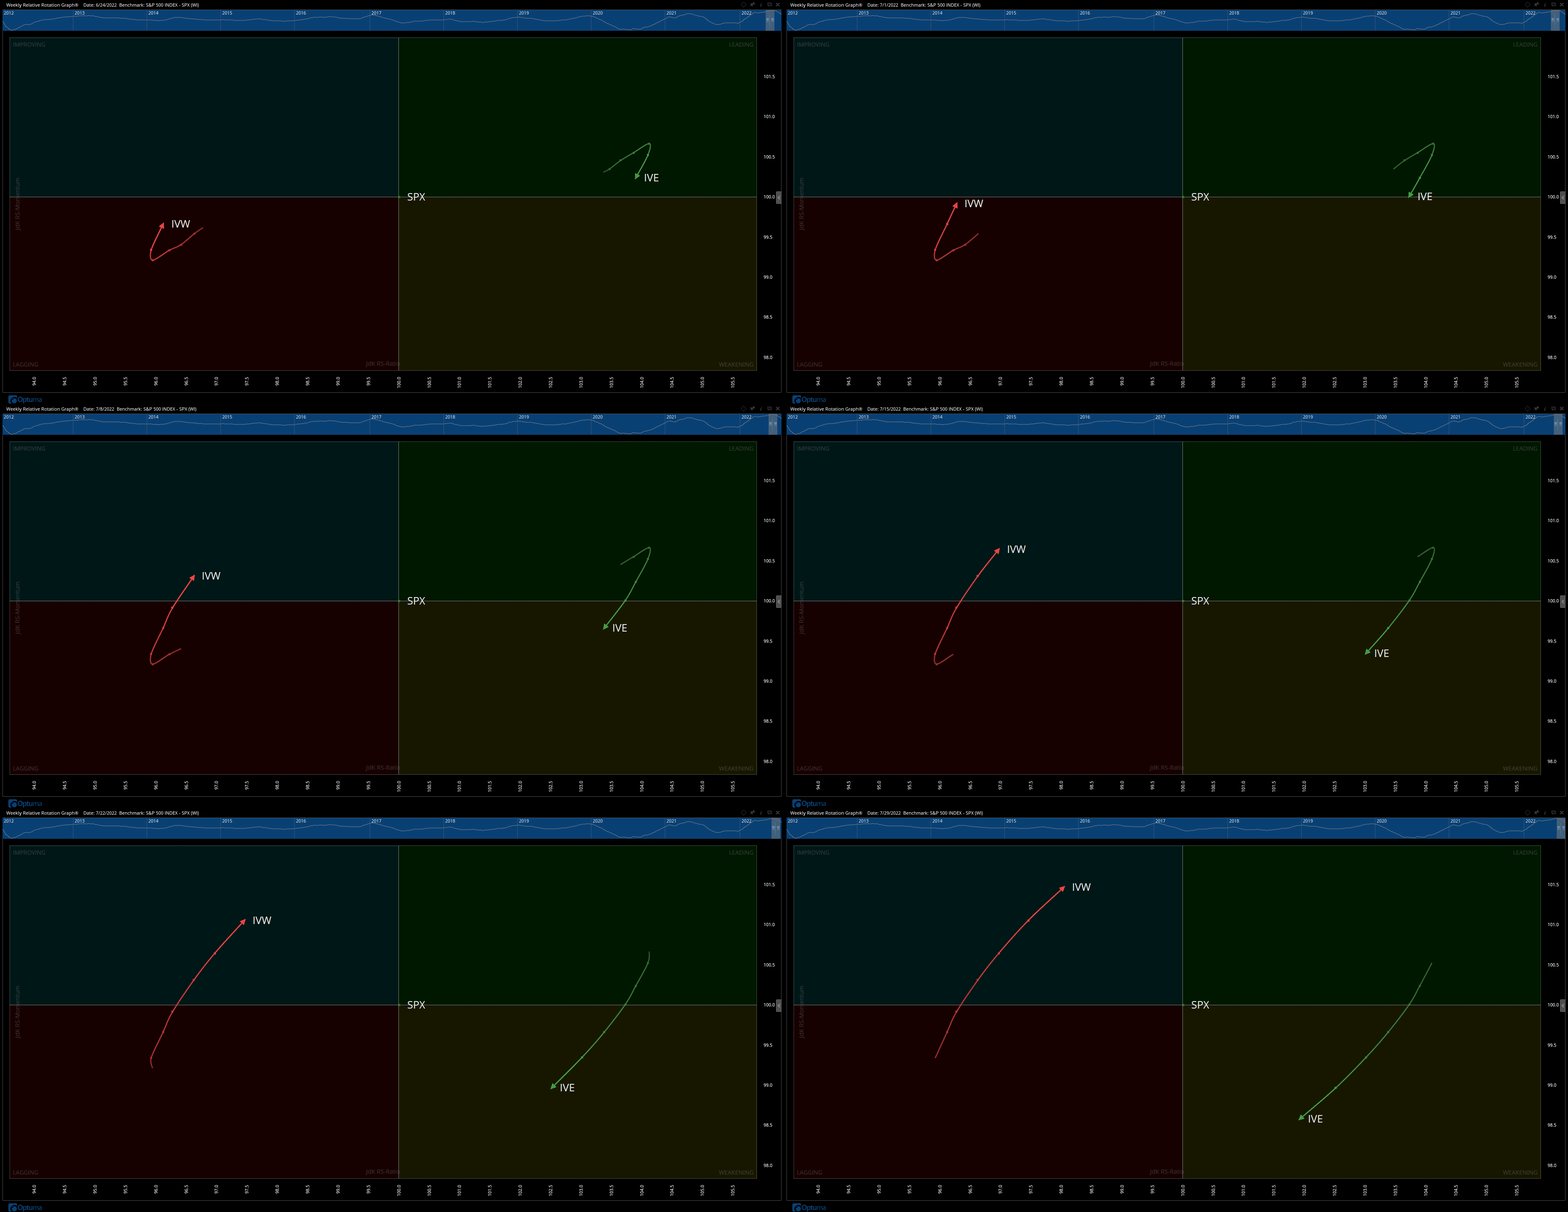
And finally, a weekly view of the iShares S&P 500 Value ETF ticker $IVE, and the iShares S&P 500 Growth ETF ticker $IVW, relative to the S&P 500 as the benchmark.
Here we see the $IVW Growth ETF moving North and East, indicating increasing relative strength and momentum.
Simultaneously we see the $IVE Value ETF moving South and West, indicating decreasing relative strength and momentum.
As you can see, the changing of the guard is likely underway…
That said, we feel the TACTICAL and CONFIRMED ENTRY has YET to present…
We’d love to have you onboard when it does…


Great job Bennett.
Nice to get updates on the weekend. Can’t always catch you during the week. -MD