CPI Selloff, Is Hope Lost For The Bulls?
By Bennett Tindle September 14th, 2022
As you know, at TradingAnalysis.com, we’ve always specialized in the Elliott Wave Principle.
We’ve come to appreciate the clear decision levels it offers us in terms of analyzing and forecasting markets, and as a result pay close attention when key patterns are invalidated.
Most recently we brought your attention to the expected decline in August, citing key uptrend invalidation levels, or decision points, in the major US indexes.
Those key uptrend invalidation levels have since been broken to the downside.
And yesterday, following a hotter than expected CPI print for August, markets sold off to the tune of -5.54% in the Nasdaq 100, and -4.32% in the S&P 500.
So, from an Elliott Wave perspective, the traditional uptrend pattern has in fact been invalidated.
But when looking across the board at how certain growth stocks and sectors are behaving, I’m not so sure it’s going to be that easy.
Which is why we are here today…
As always, I want you to be prepared.
And don’t get me wrong — I still remain bearish.
I respect what my preferred trading and investing methodology is telling me, and I can substantiate it when looking across the macro landscape as I’ll demonstrate below.
But if we know one thing for certain, it’s that anything is possible.
Which is why I wanted to take this opportunity to once again reiterate my view, but also provide an alternate for those of you who remain bullish.
Bearish Market Scenario
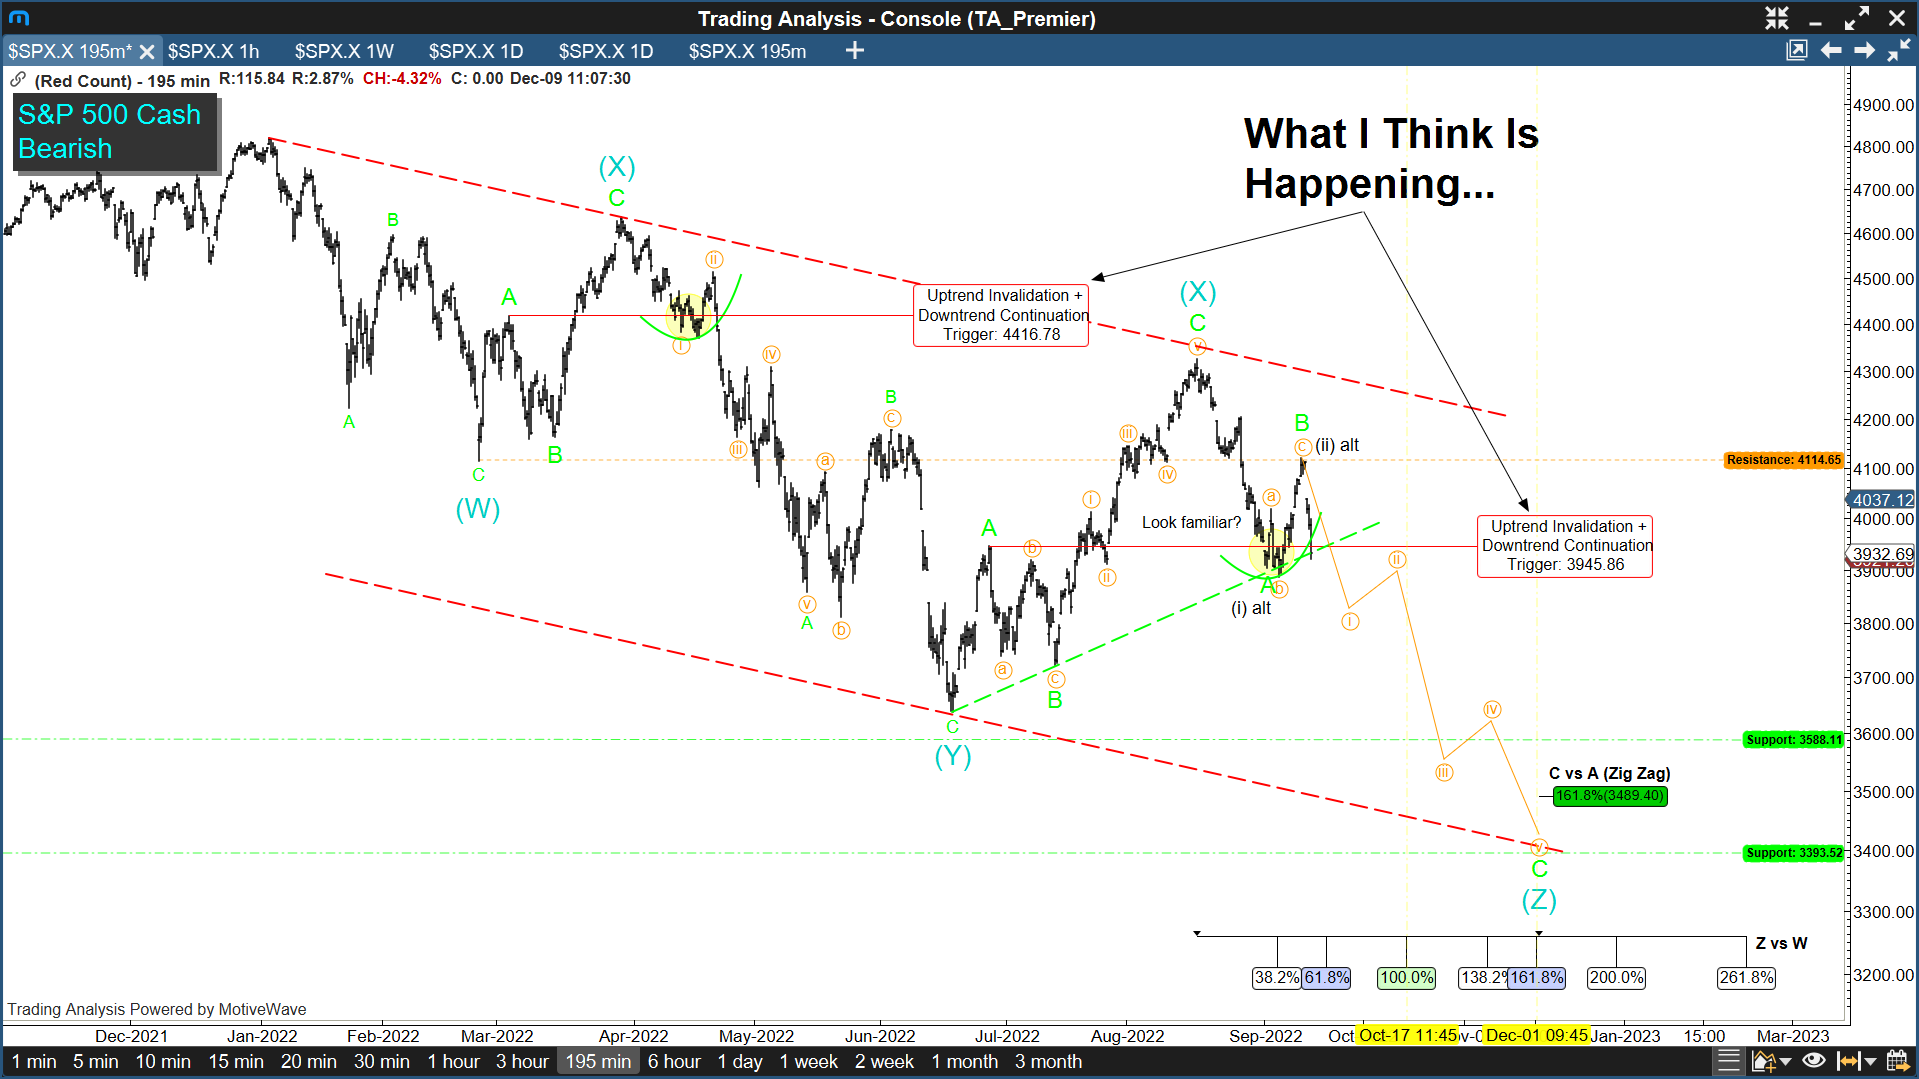
Here we can see what remains to be my preferred interpretation of the major US indexes, with markets now on the way to new lows following the corrective summer rally.
If this is the case; although I believe we retrace yesterday’s decline first, we need to see acceleration with increasing momentum through the September 6th index low to confirm the trend.
Crude Oil Rally
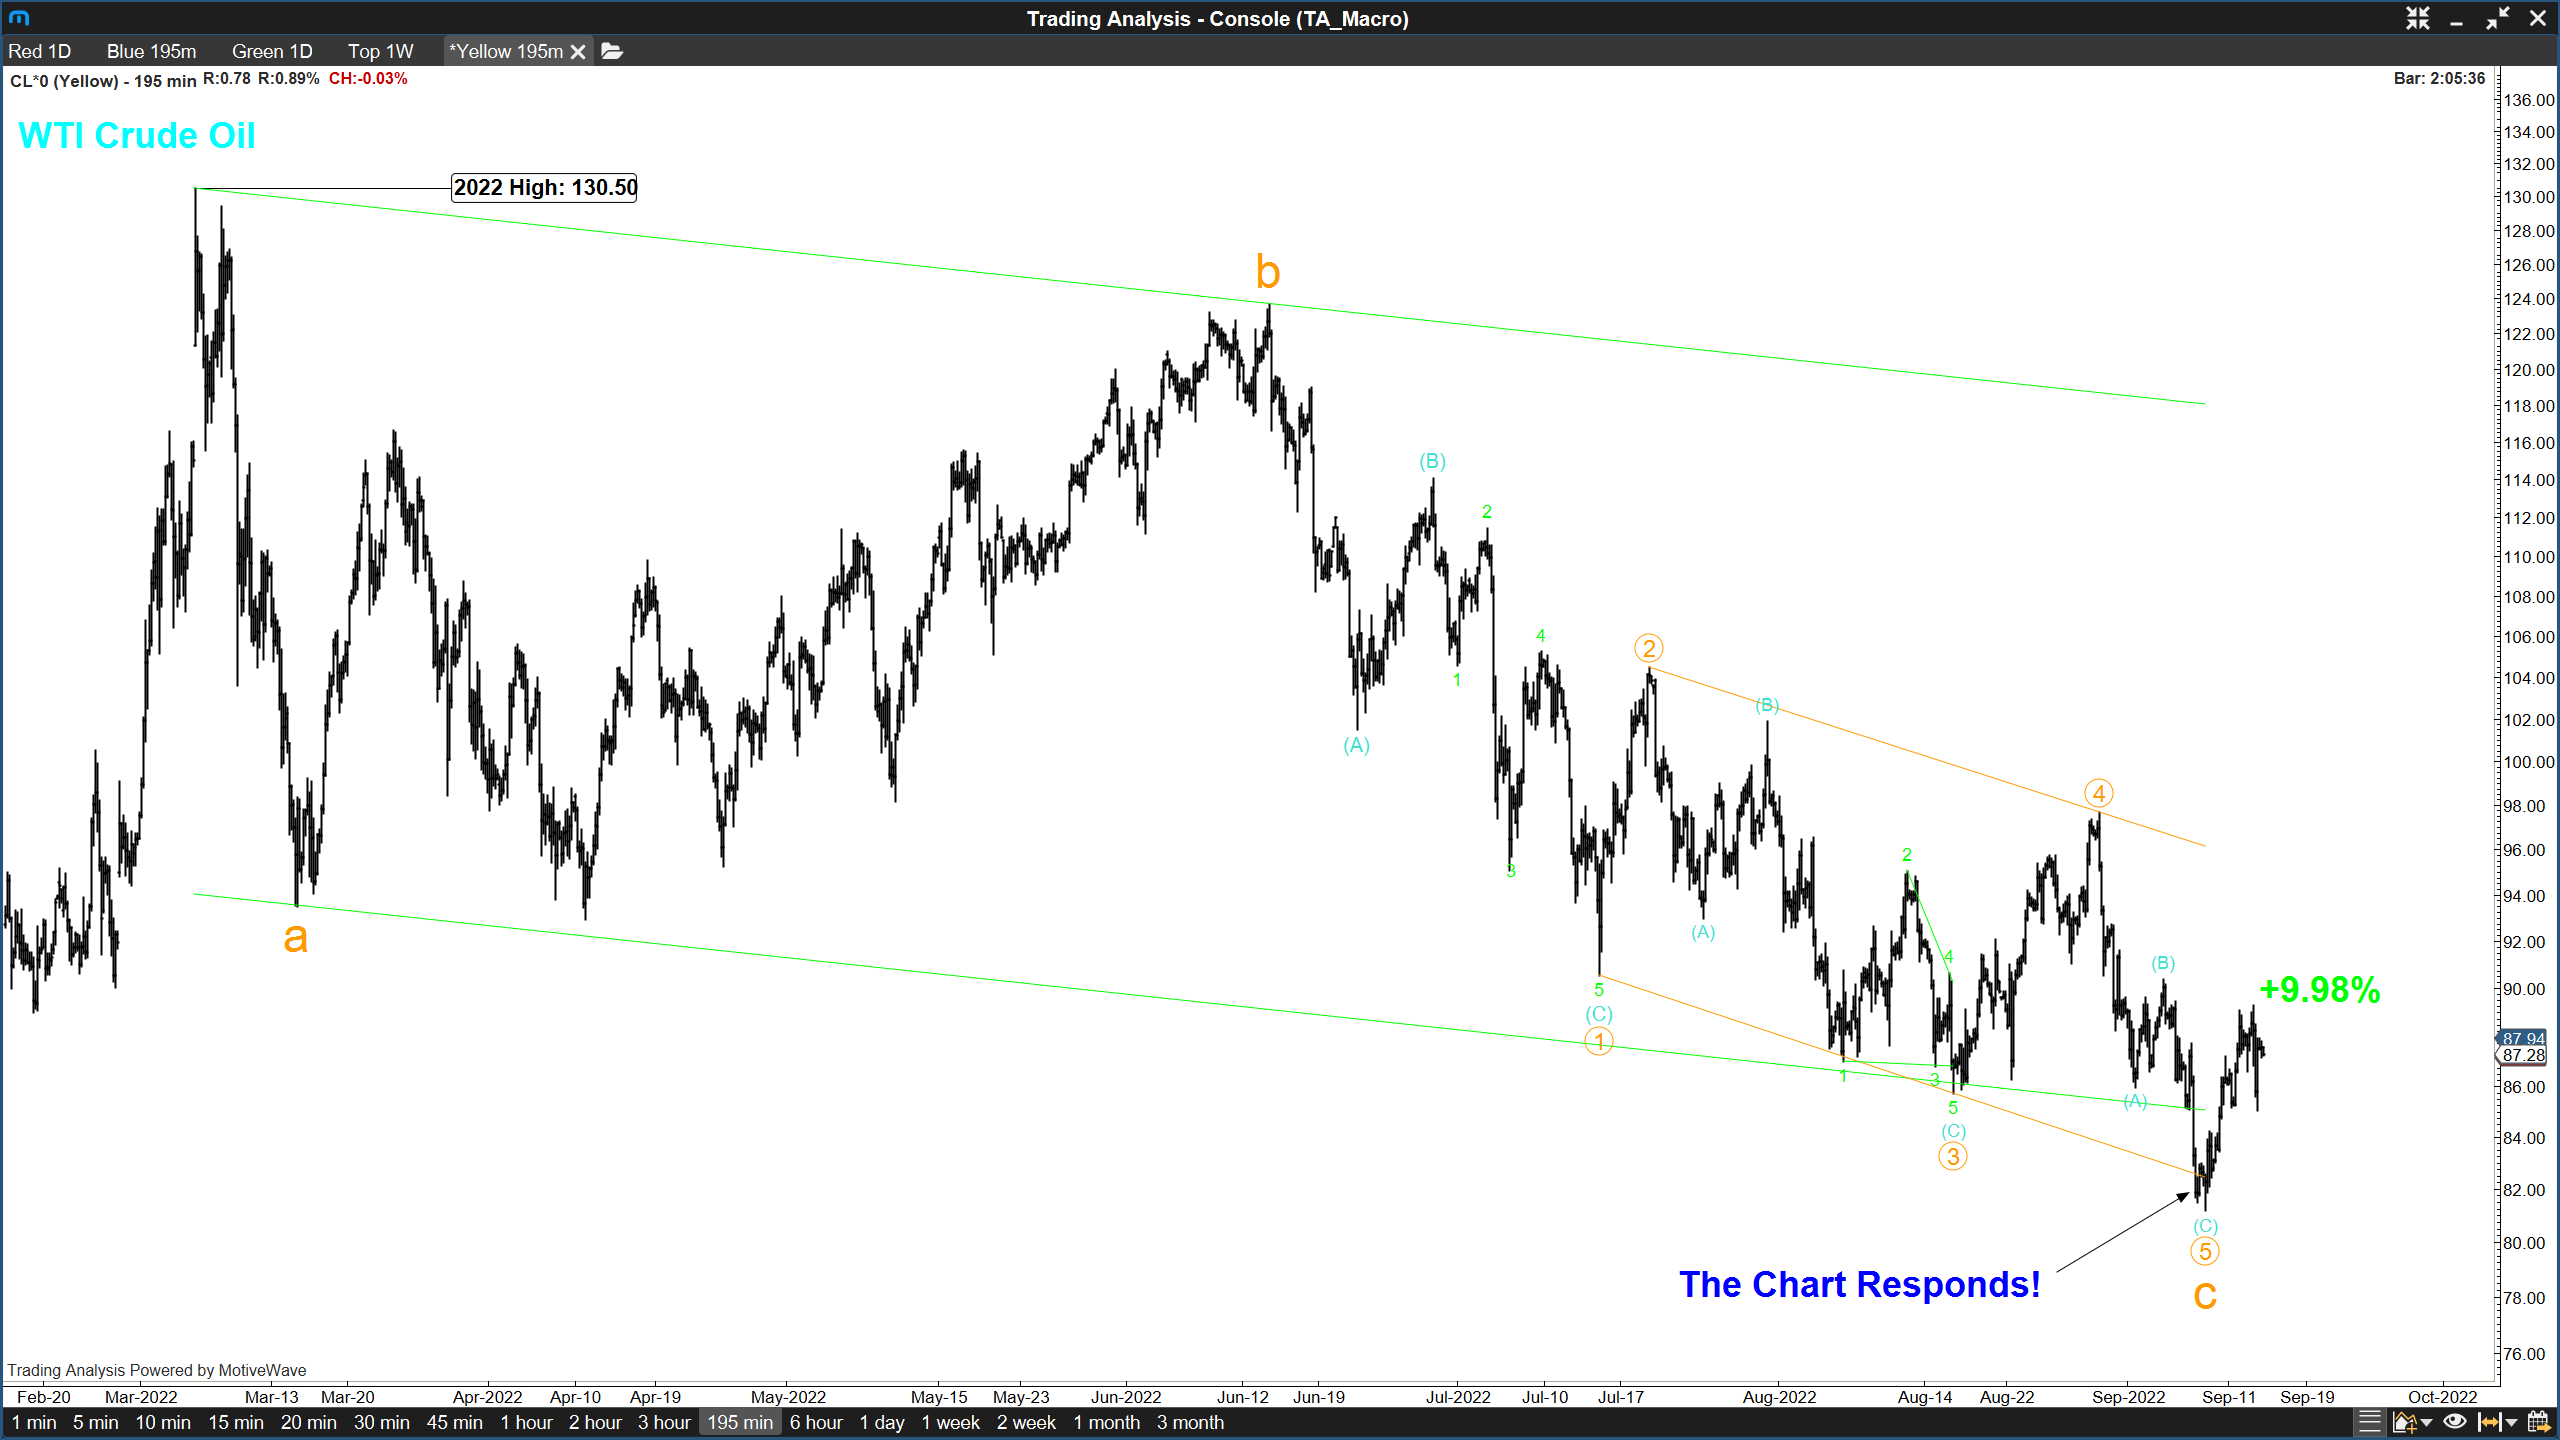
If you’ve been following my blog posts and weekly emails, then the above chart of WTI Crude Oil should look familiar.
As you can see above, following our update on the Energy Sector last Tuesday, WTI Crude Oil not only sold off into the expected support trendline, but it has since delivered a near 10 percent rally.
Meaning we may have the first technical catalyst to signal a strong upside reversal in Crude Oil. If that proves to be the case, I don’t need to explain the implications on the inflation front…
Dollar Index Rally
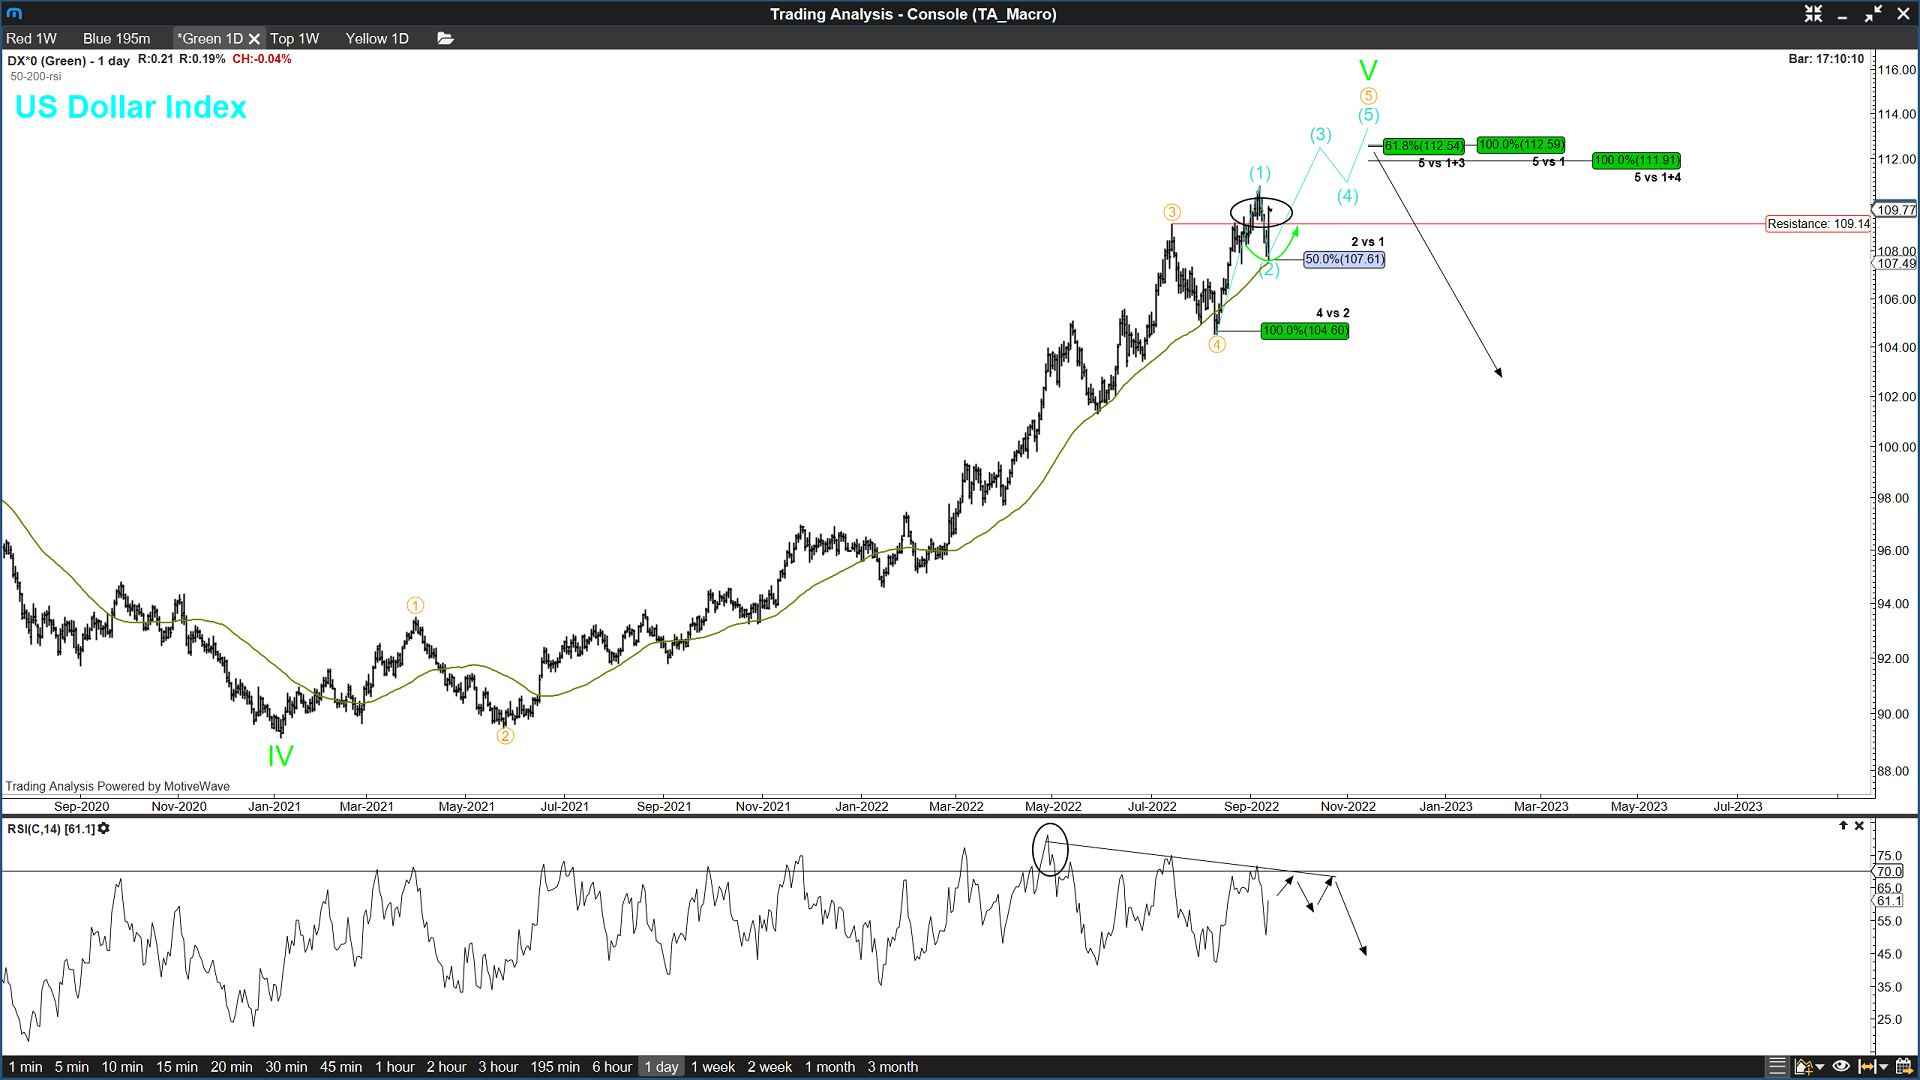
Another macro consideration on my mind is the above chart of the US Dollar Index.
Here we see recent support demonstrated at two key technical levels, including a 50% retracement of the August 11th – September 7th rally, as well as the 50-day moving average.
We also just moved back above resistance from July 14th, a level we rejected on August 23rd.
One positive takeaway from this chart is the momentum divergence we are seeing in the daily 14-period RSI, as well the major overhead Fibonacci resistance zone.
So while I do see further upside on the horizon in the dollar index, I expect it to be a series of highs, that results in the completion of an uptrend which began in January of last year…
… Which supports my more dominant market outlook, that calls for the end of the indexes decline later this year…
Bullish Scenario
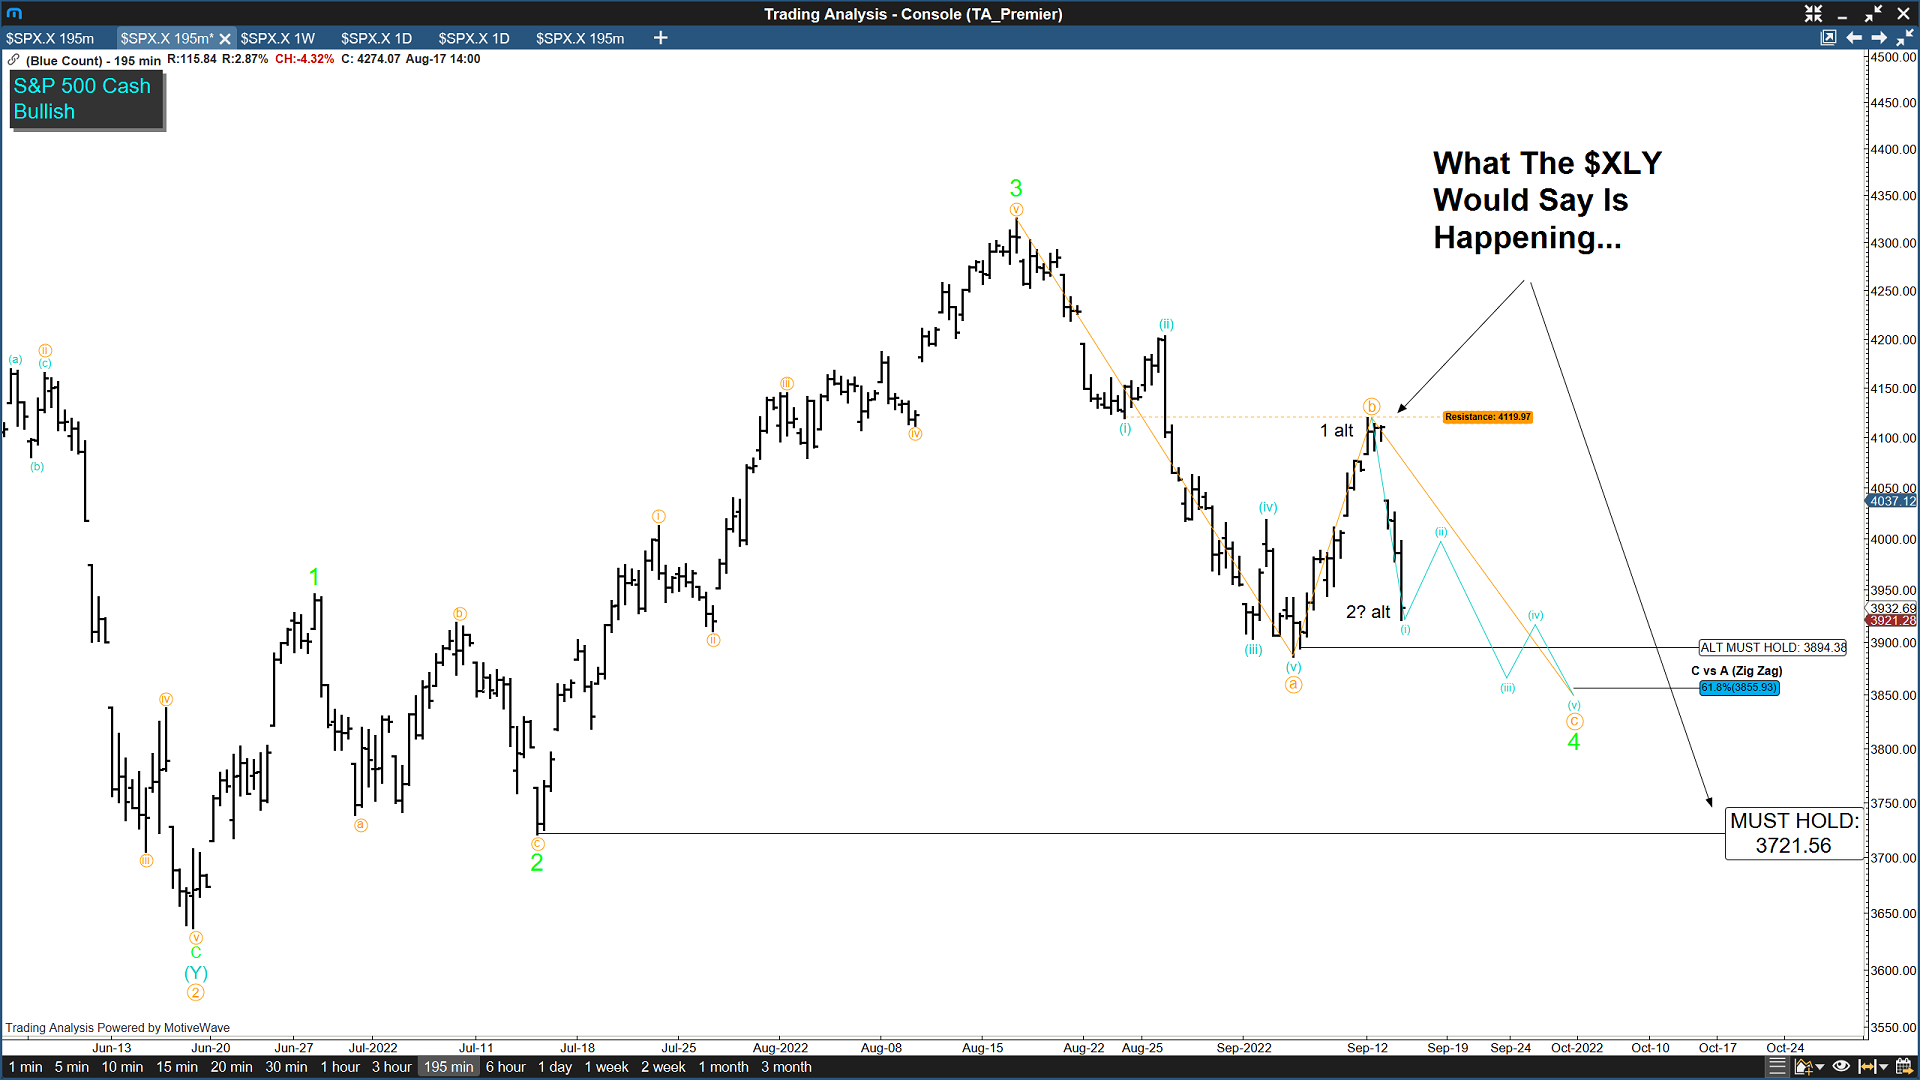
Now, what if I’m wrong? Are there any bullish patterns that keep the uptrend alive? Great question!
Although the traditional “impulsive” uptrend pattern has indeed invalidated in the major indexes, hope is not lost for market bulls.
And in the chart above (which starts at the June low), we see two key levels in the S&P 500 that would need to hold in order to suggest the Wednesday CPI selloff was just a bull shakeout and bear trap.
In the S&P 500 shown above, those levels would include 3886.75, the September 6th low, and 3721.56, the July 14th low. If we don’t roll over, but instead maintain positive price action above those levels, then perhaps the 2022 lows are already in…
Now historically speaking, leading expanding diagonals are very rare.
So although the above chart remains technically valid per the rules and guidelines of the Elliott Wave Principle, I only give it about a 20% probability of success…
Tesla Uptrend Remains Valid

To wrap up, allow me to introduce the chart of Tesla…
Unlike the broader market indexes, the stock of Tesla has yet to invalidate its impulsive uptrend pattern. The same is true for the overall chart of the Consumer Discretionary sector…
And this isn’t the only name in the Consumer Discretionary sector with a bullish trend…
So keep this chart on your watchlist. If we can maintain support above 280, we could be on the way to 340/sh.
Alternatively, if Tesla doesn’t make a new high above 314.67, look for a move under $264.21 to signal a move back to the May lows…
That is all for today, be sure to save these charts, and I’ll see you back on the next one!
Regards,
–Bennett Tindle
Chief Analyst
TradingAnalysis.com
@eWavePilot
Todd On CNBC
“Our Founder Todd Gordon spoke about this very dynamic yesterday on CNBC. The Stock Indexes are threatening deeper levels based on continued inflationary pressures, but yet Consumer Discretionary stocks, led by Tesla, are showing increasing relative strength!”
Prefer Our Video Format?
Watch Us Live Every Wednesday!
Join us for our weekly TA Live! Wednesday Livestream show, where the entire team gets together to bring you the latest market updates. Streamed live Wednesday at 8:45 am Eastern, our coverage includes everything from the Major Market Indexes, to Individual Stock and Macro analysis! Let us show you what we have to offer, what Elliott Wave has to offer, and more importantly how we can help you improve your trading!