
Tesla stock is at the lows of the year and testing a significant low set back almost one year ago on April 23rd, 2023 at $152.37. Will it break? I think so. Is the super charged valuation and amazing run for the stock over? I’m not so sure, just yet. There is technical support just below the current price that you may want to observe before throwing in the towel as we head into earnings next week on the 23rd.
There is no shortage of negative news flow that’s driving the stock lower. The list includes price cuts on vehicles in Europe and Asia, increased cost from Cybertruck production, a 10% workforce reduction, the lowest delivery figures in over 2-years (that were below even the lowest street estimates), and a sidelining of it’s $25k vehicle to focus on self-driving robotaxi platform.
Tesla shareholders, myself included, are coming to the realization that consumer appetite for electric vehicles combined with increased competition are significant headwinds for the stock. The possibility for outsized returns for the company that achieves autonomous driving and mass transport are very real, but like Facebook’s transition to the metaverse, how far out and at what cost?
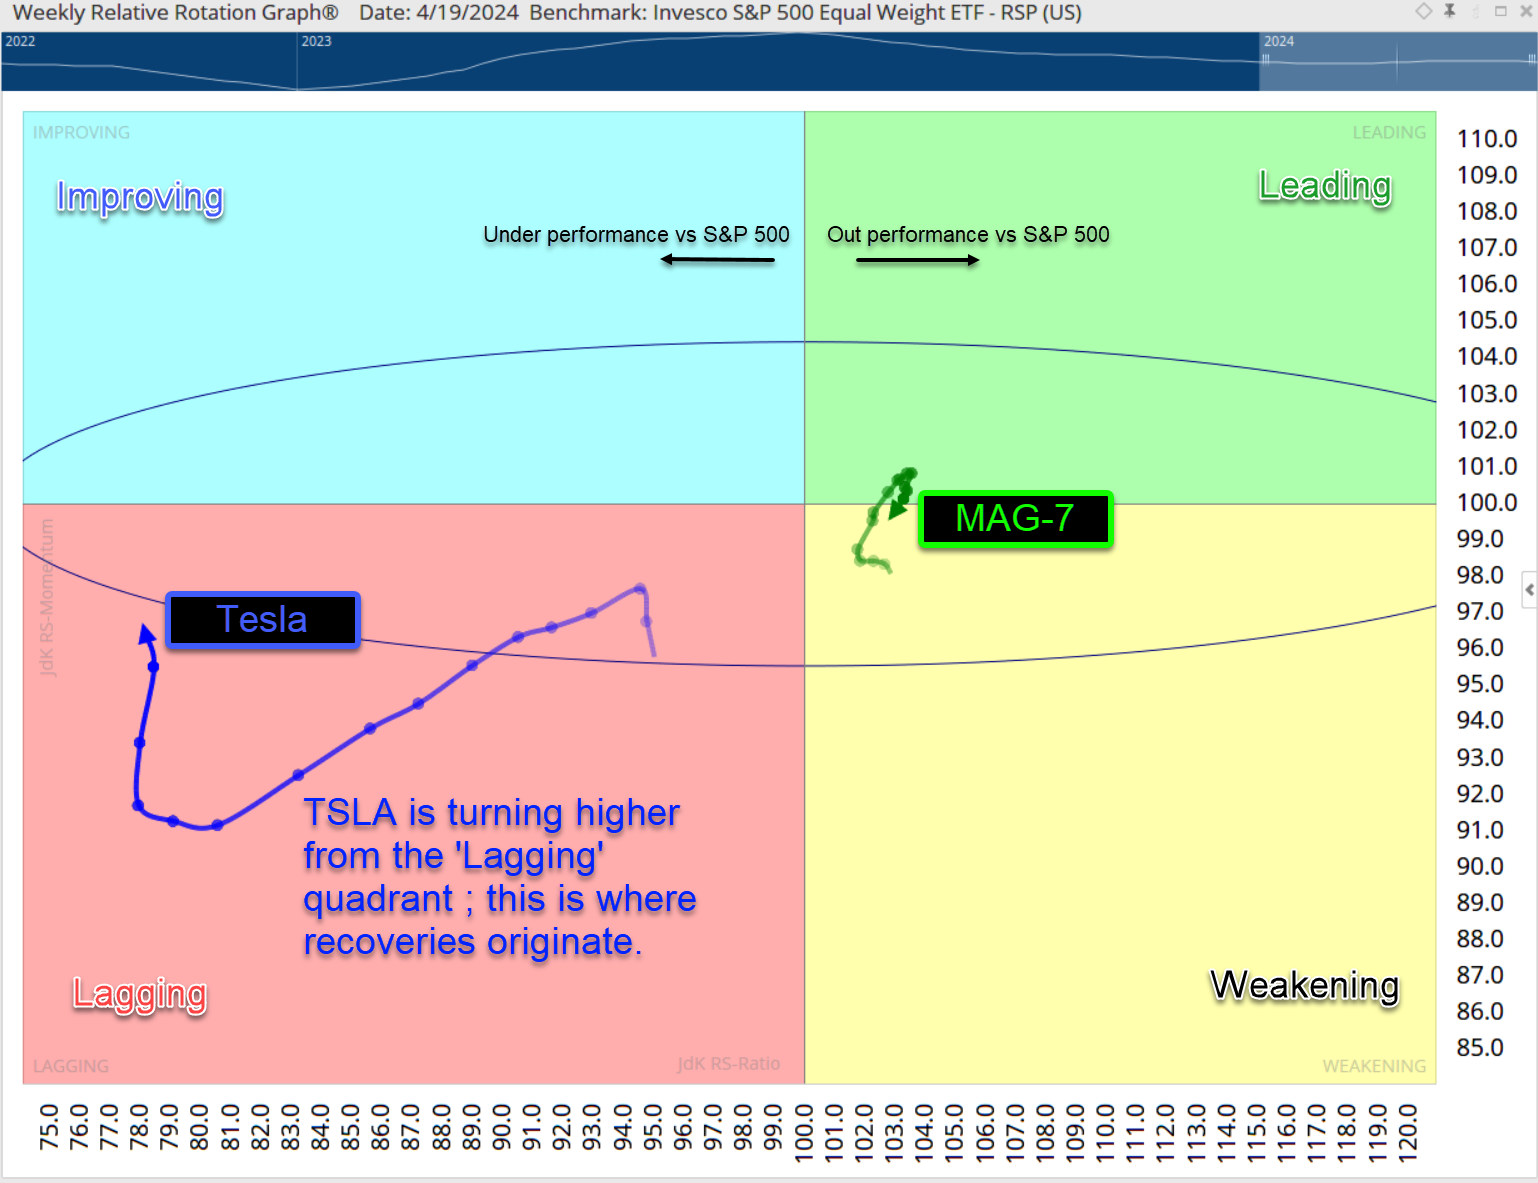
Looking at the weekly Relative Rotation Graph of Tesla stock this year you can see the tail ( blue arrow) is far to the left of the vertical east / west divide indicating significant underperformance relative to the benchmark S&P 500. A bright spot however is the RRG tail has turned north and is attempting to hook to the right moving out of the significant under-performing position. But with the most recent drop in price towards last year’s low of $153 the arrow has begun to move back to the left further into a weakening condition.
For comparison I’ve also included an equal weight MAG7 index to show that these 7 stocks, TSLA included, have outperformed the S&P 500 this year as it remains right of the east / west divide. True the arrow has turned back to the south and we’ll be watching for continued movement to the west indicating the mega-cap growth stocks are losing ground to the benchmark S&P 500
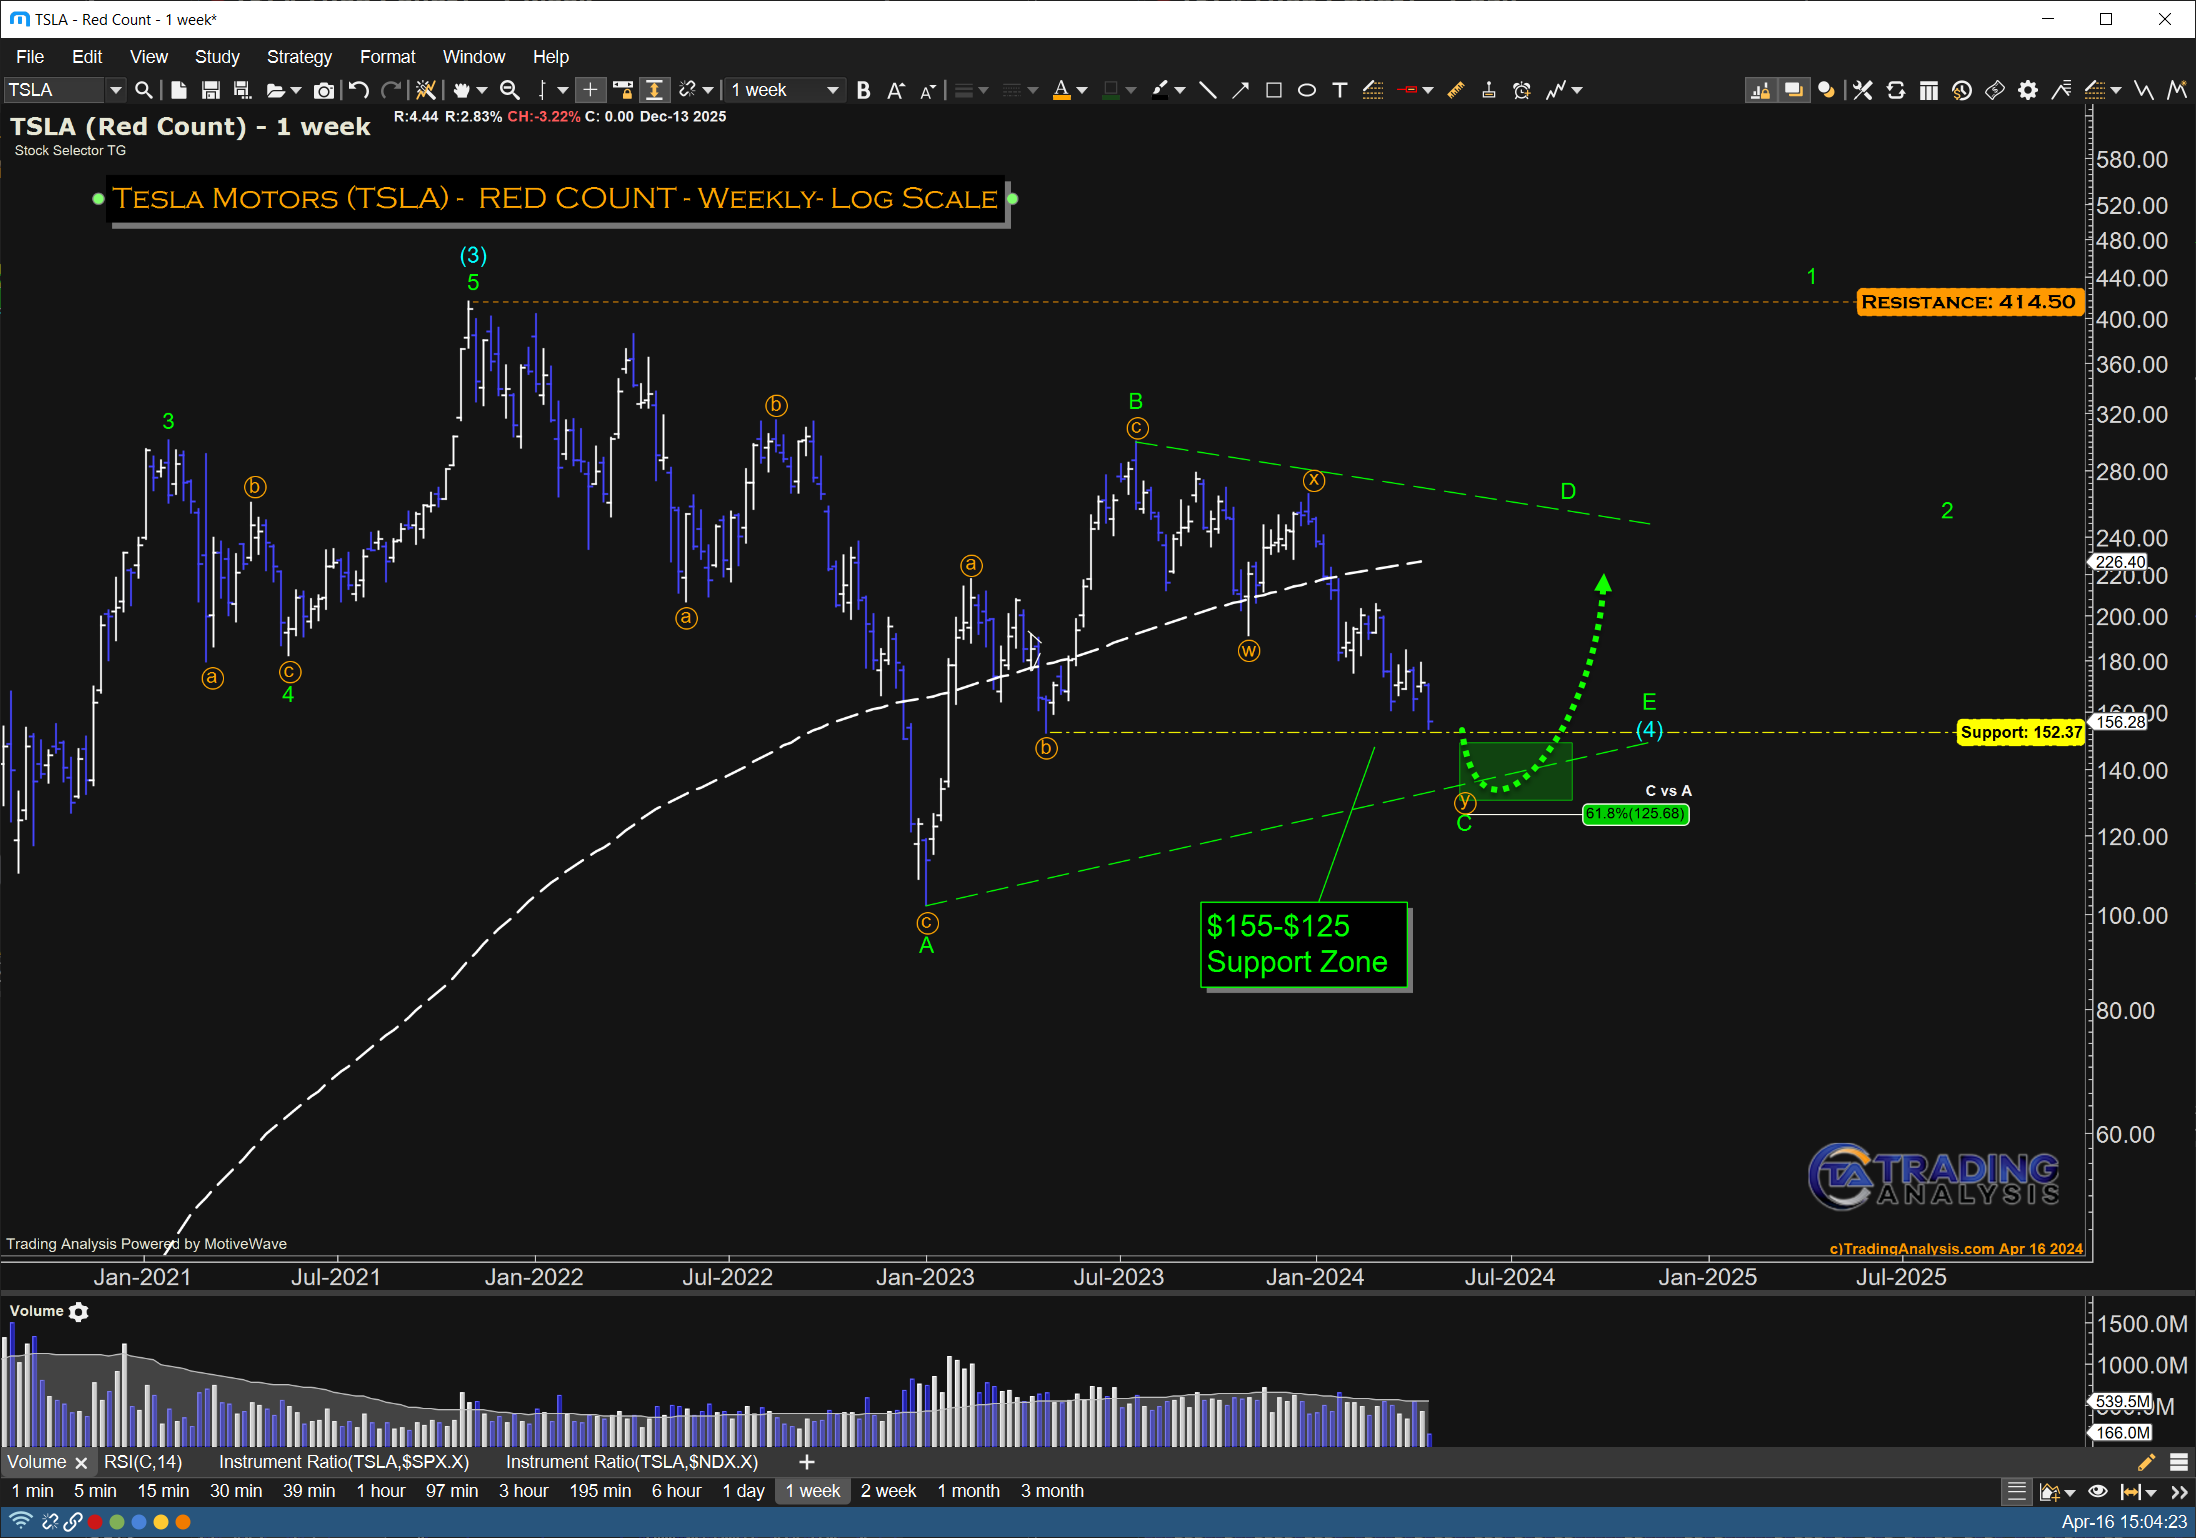
Turning to the Tesla Weekly Chart using our Elliott Wave analysis we are placing TSLA in a triangle pattern that consists of 5 swings of lower-highs and higher-lows that is a consolidation pattern. These 5 swings are labeled ‘A-E’ in green. The anticipated support zone of green C-wave is between $155-$125 from a combination of last year’s April 23rd’s earning lows, combined with a Fib projection of this current decline at an expected $125.68 support level.
I currently hold a 2% allocation of TSLA in our growth portfolio at Inside Edge having reduced the position from as much as 6% in the past year. We are also hedged in the near-term with a May 17th 150/135 put spread in our research business TradingAnalysis.com.
All eyes and ears will be on Elon and the conference call following earnings next week to hear how he plans to address this horrible sequence of events for Tesla. If Elon fails to comfort investors and that $125 support zone does not hold, the next obvious technical level is the 2022 low at $101.82. Again referring to the Elliott Wave model, the outlook for a successful defense of the double bottom is not hopeful and our expectation is TSLA will then trade with a 9-handle for the first time since Aug 2020. At that time I will probably be out of all Tesla for the first time ever.
-Todd Gordon, founder of Inside Edge Capital, LLC
We offer active portfolio management and financial planning – more information can be found here (please link to www.InsideEdgeCapital.com)
(DISCLOSURES: Gordon owns TSLA personally and in his wealth management company Inside Edge Capital Management, LLC Charts shown are MotiveWave and Optuma.)

Todd Gordon
Founder and Lead Analyst of Trading Analysis
Todd has been trading as a career for the last 20+ years. His goal is to not only provide insightful analysis, but to teach people how to think and grow as professional traders. Todd is a practitioner of Elliott Wave Theory and he uses it to gain an edge in the highly competitive trading arena. In addition to trading professionally, Todd has worked as an analyst and researcher at two different hedge funds. Click Here To Learn More about Todd Gordon