[Update!] – Crude Oil & Energy Sector Analysis
By Bennett Tindle September 9th, 2022
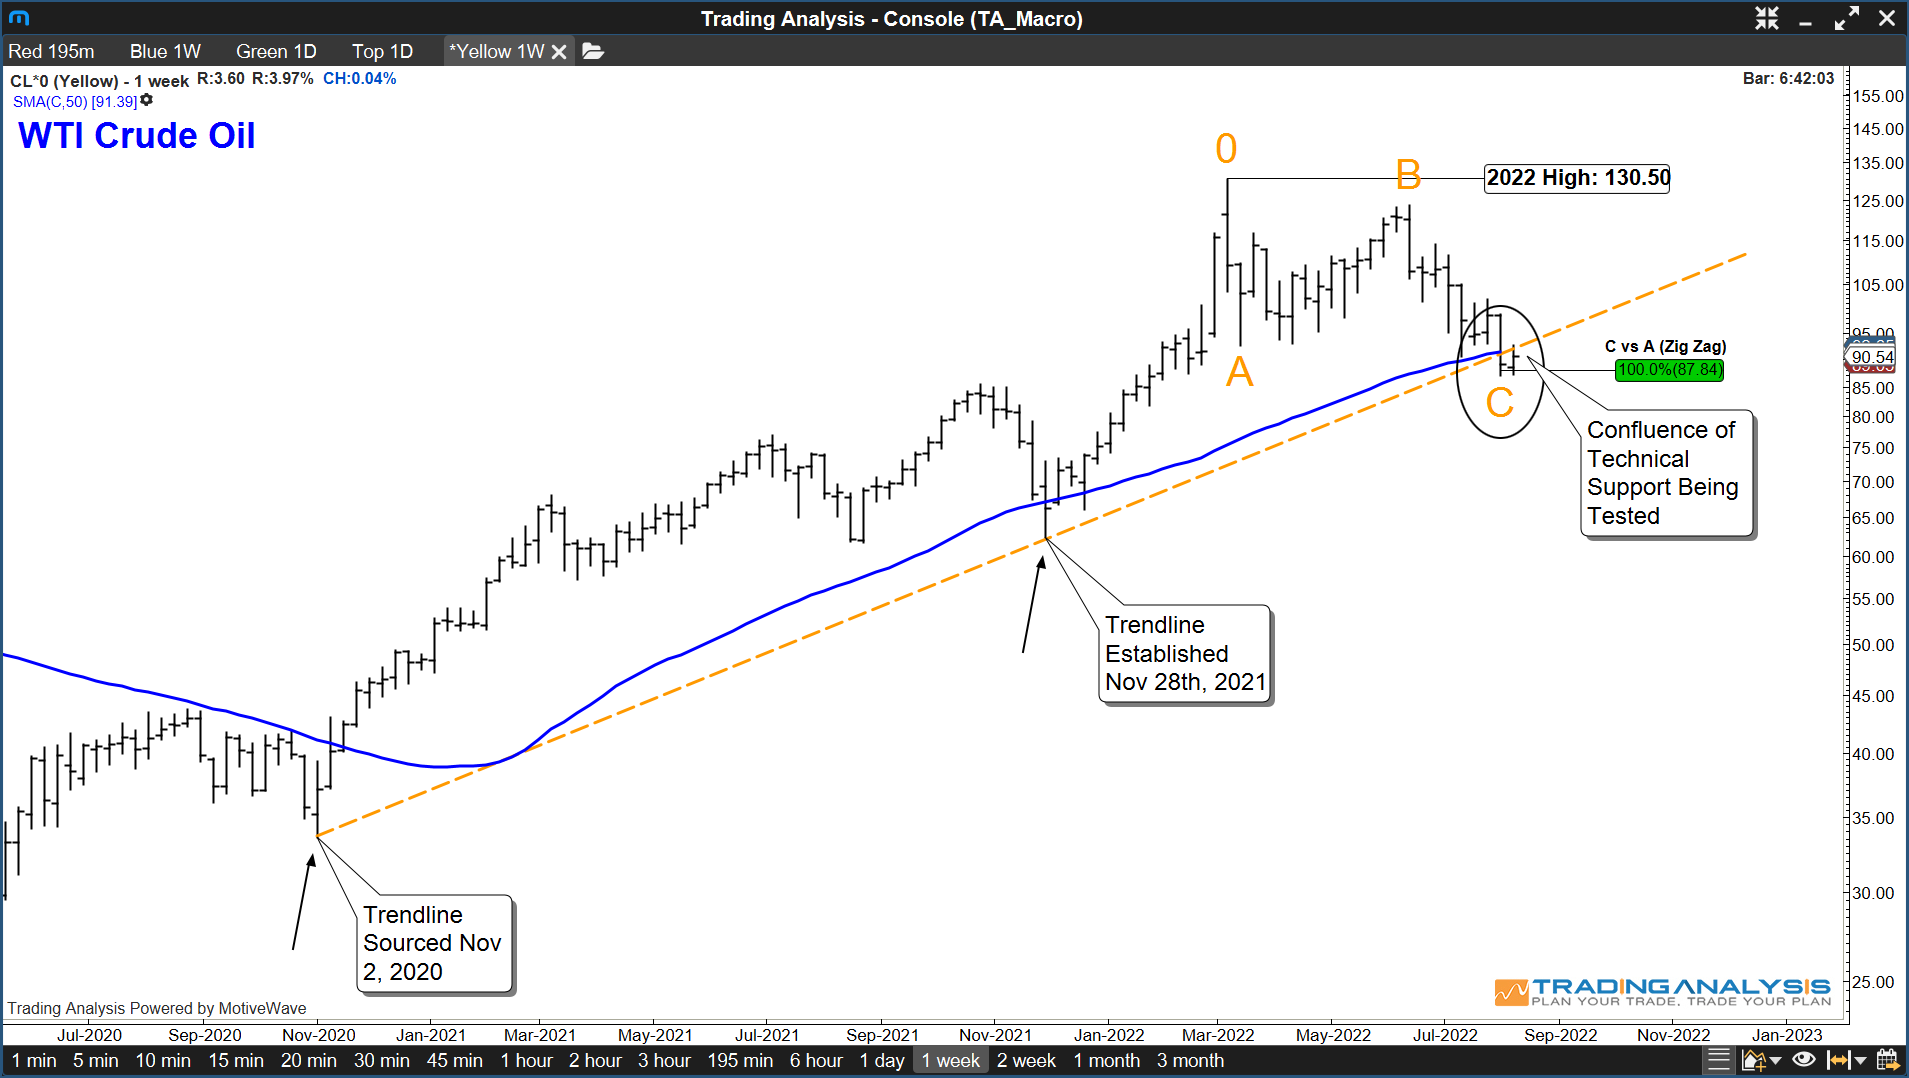
Last month we published this weekly chart of WTI Crude Oil, noting a confluence of technical support offered near $87/bbl.
Although the support zone continues to deliver rallies to the upside, they have all been sold.
Yet at the same time, every fade and probe of support has offered another upside bid.
As technicians, we know this type of pattern development can only continue for so long before a range break occurs.
With that in mind, we see the chart approaching a “make or break” decision zone, meaning the next series of lows should reveal the more dominant path forward.
Will this decline prove corrective, and take us all the way back to the March $130 area highs,
… Or did we establish a more significant top back in March, and are now gearing up to break south of support?
Either way the implications on the inflation front will be substantial…
So, tune in as I take you through the charts, showing you exactly where we expect Crude Oil to reveal its hand.


Please take a look at SPR Inventories. Since 1/2020, SPR is down 189 mil barrels of crude. Certainly puts pressure on crude prices. Also artificially lowers cost of gasoline at the pump. I don’t actually know what happens to the $$ from the sale but it has to take some liquidity out of the market(s).