
Indexes
Major Time Frame
Medium Time Frame
Minor Time Frame
Major Time Frame
Medium Time Frame
Minor Time Frame
Market commentary:
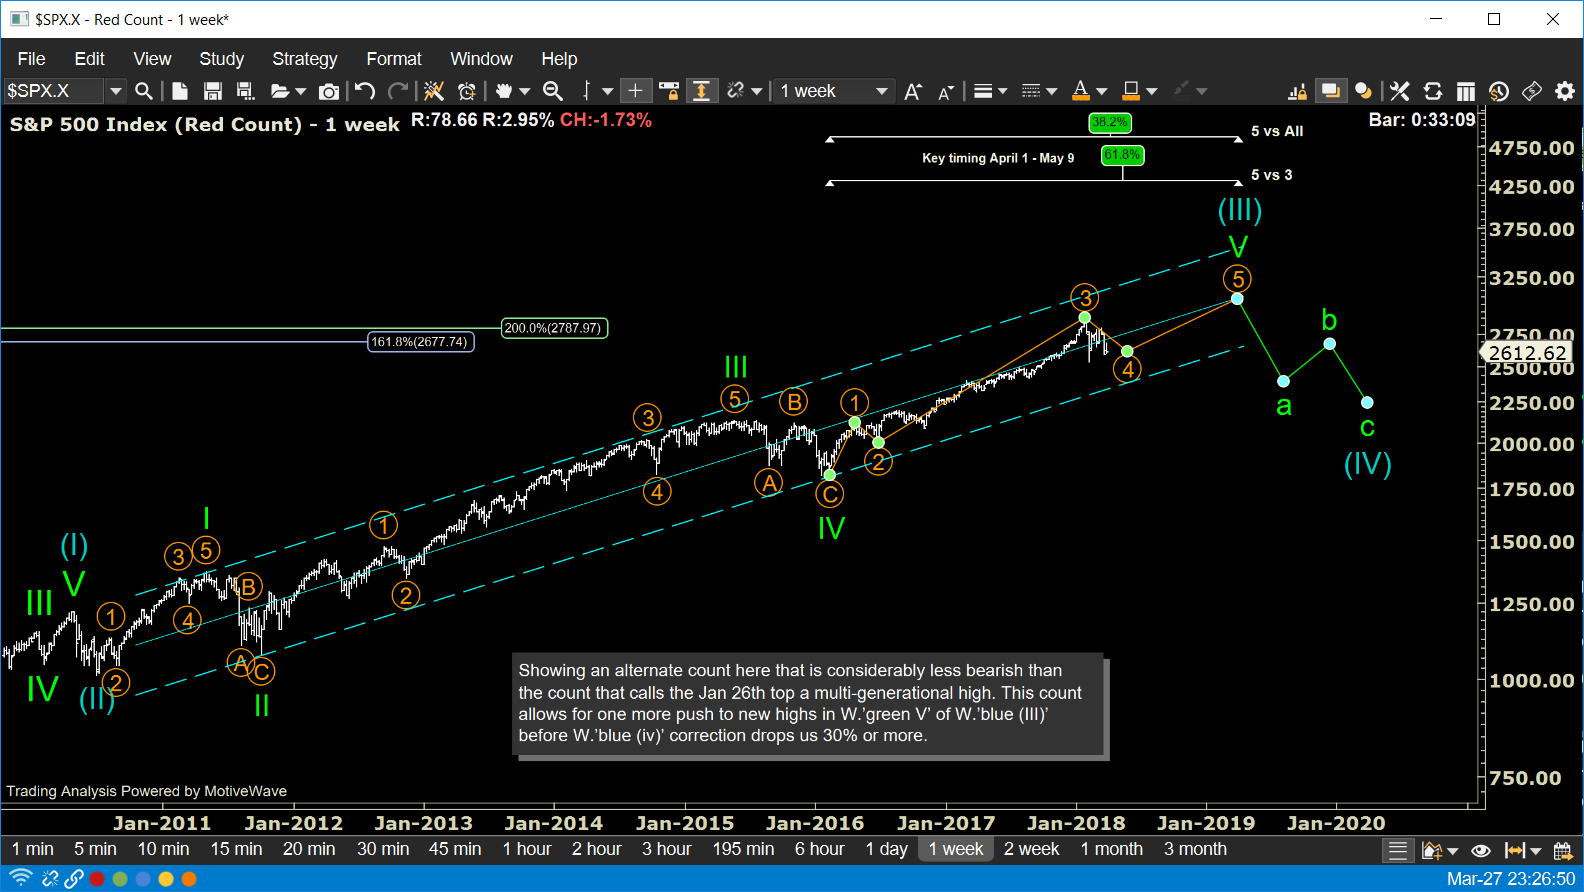
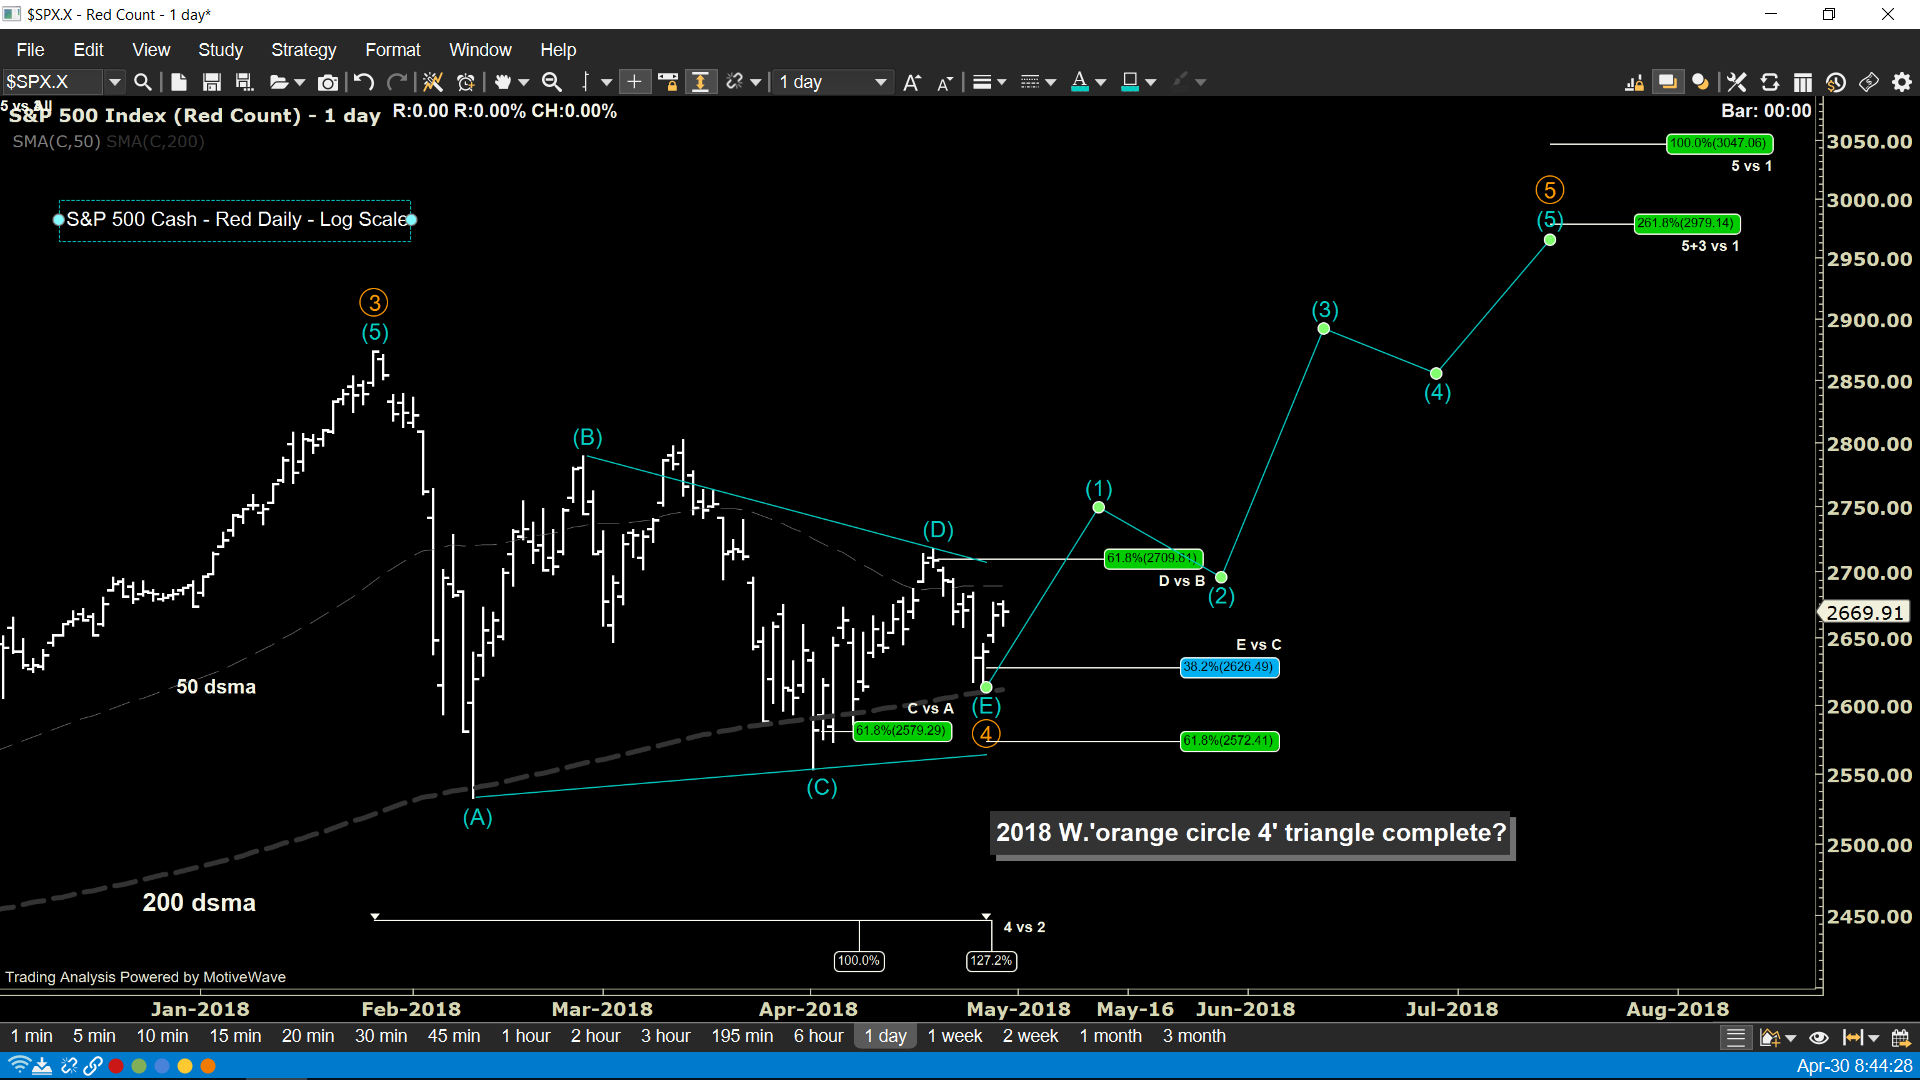
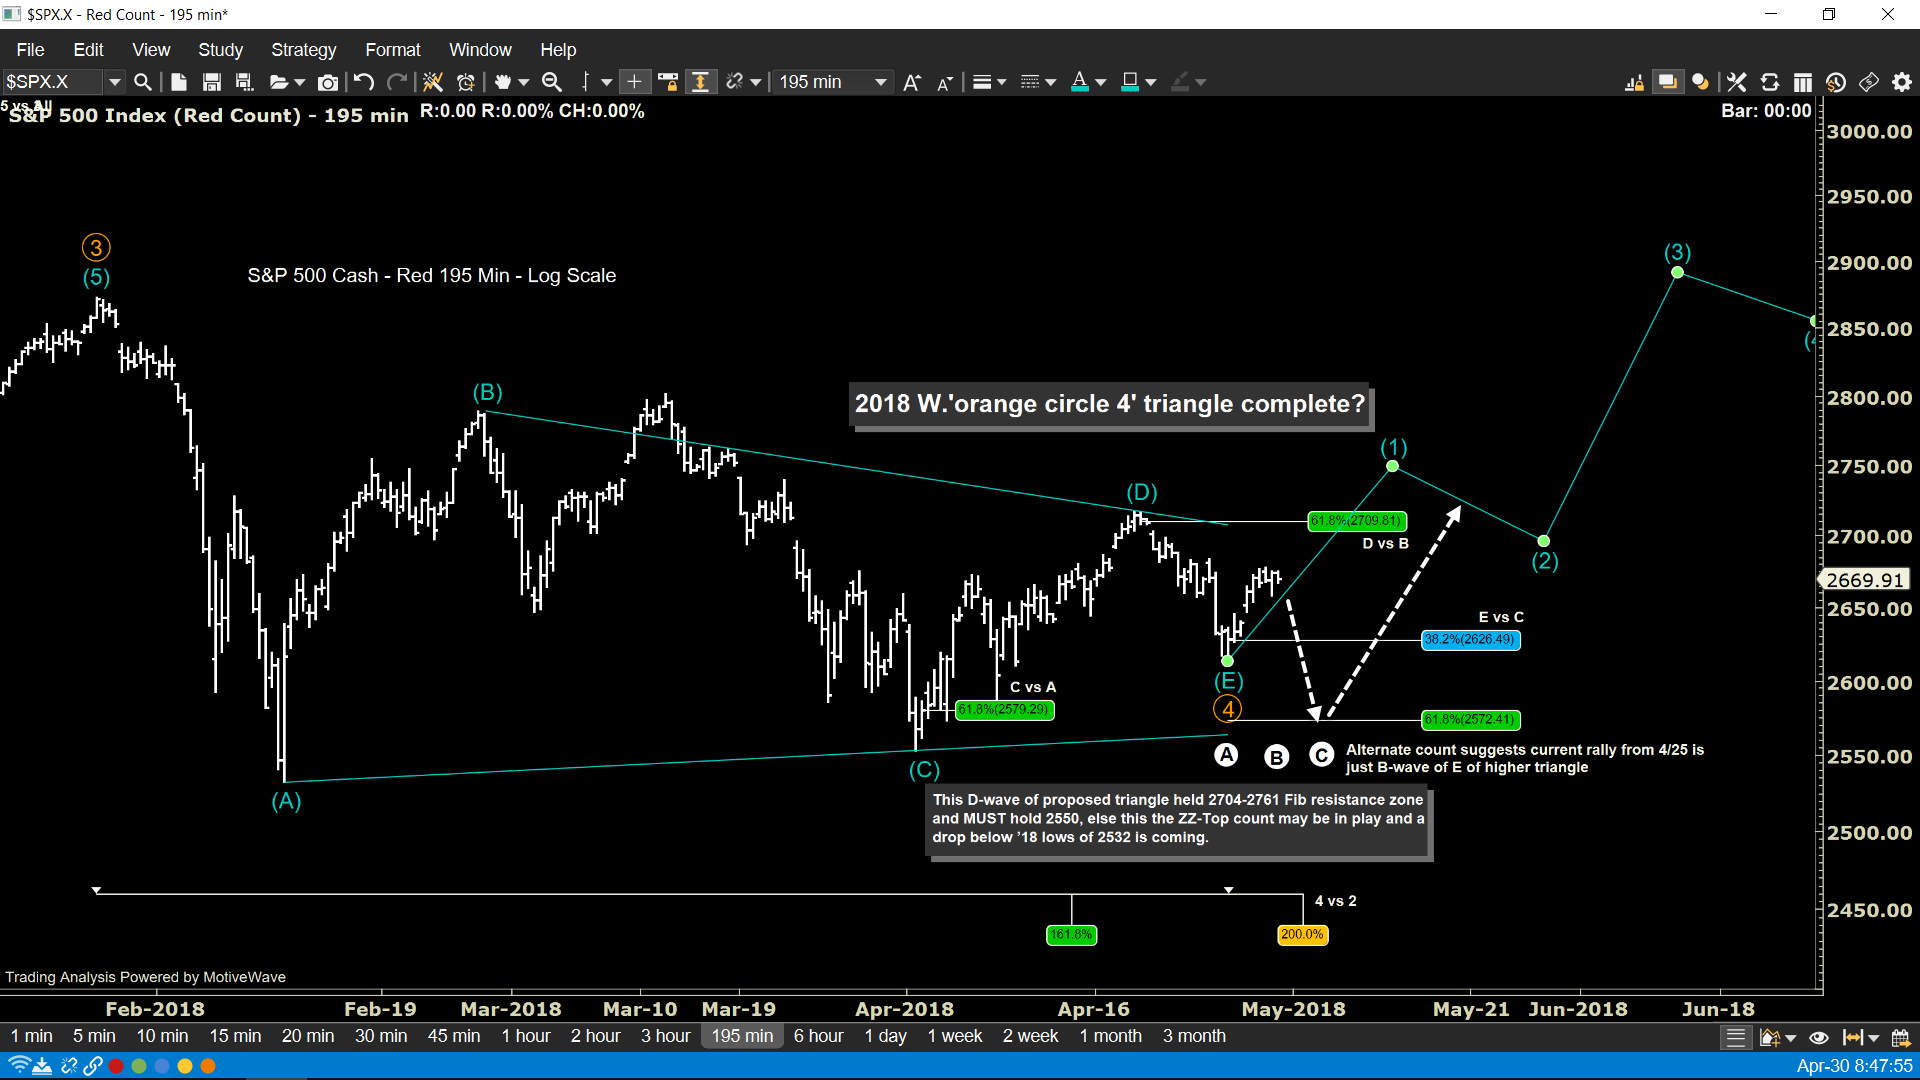
We are going to operate under the assumption that the 2018 triangle may be complete labeled as W.'orange circle 4'. If so, we should move higher and break 2709 resistance in W.'blue (1)' as seen on the Minor Time Frame. If the alternate count plays out, this is just B-wave rally that should remain below 2700, sell off in C-wave to then complete the 2018 Wave 4 triangle.
Major Time Frame
Medium Time Frame
Minor Time Frame
Market commentary:
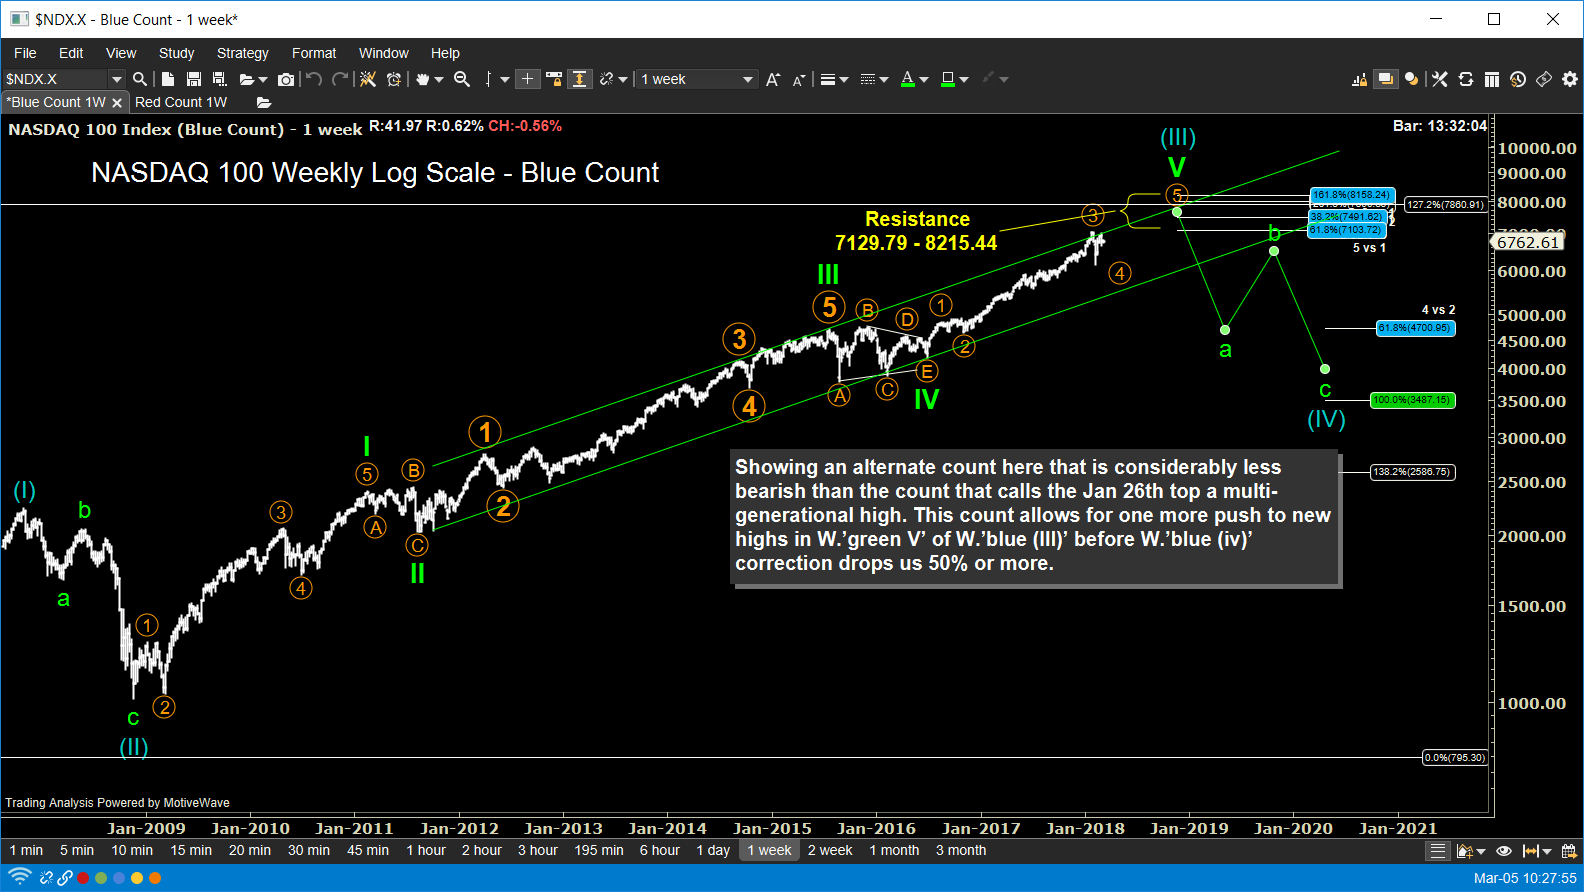
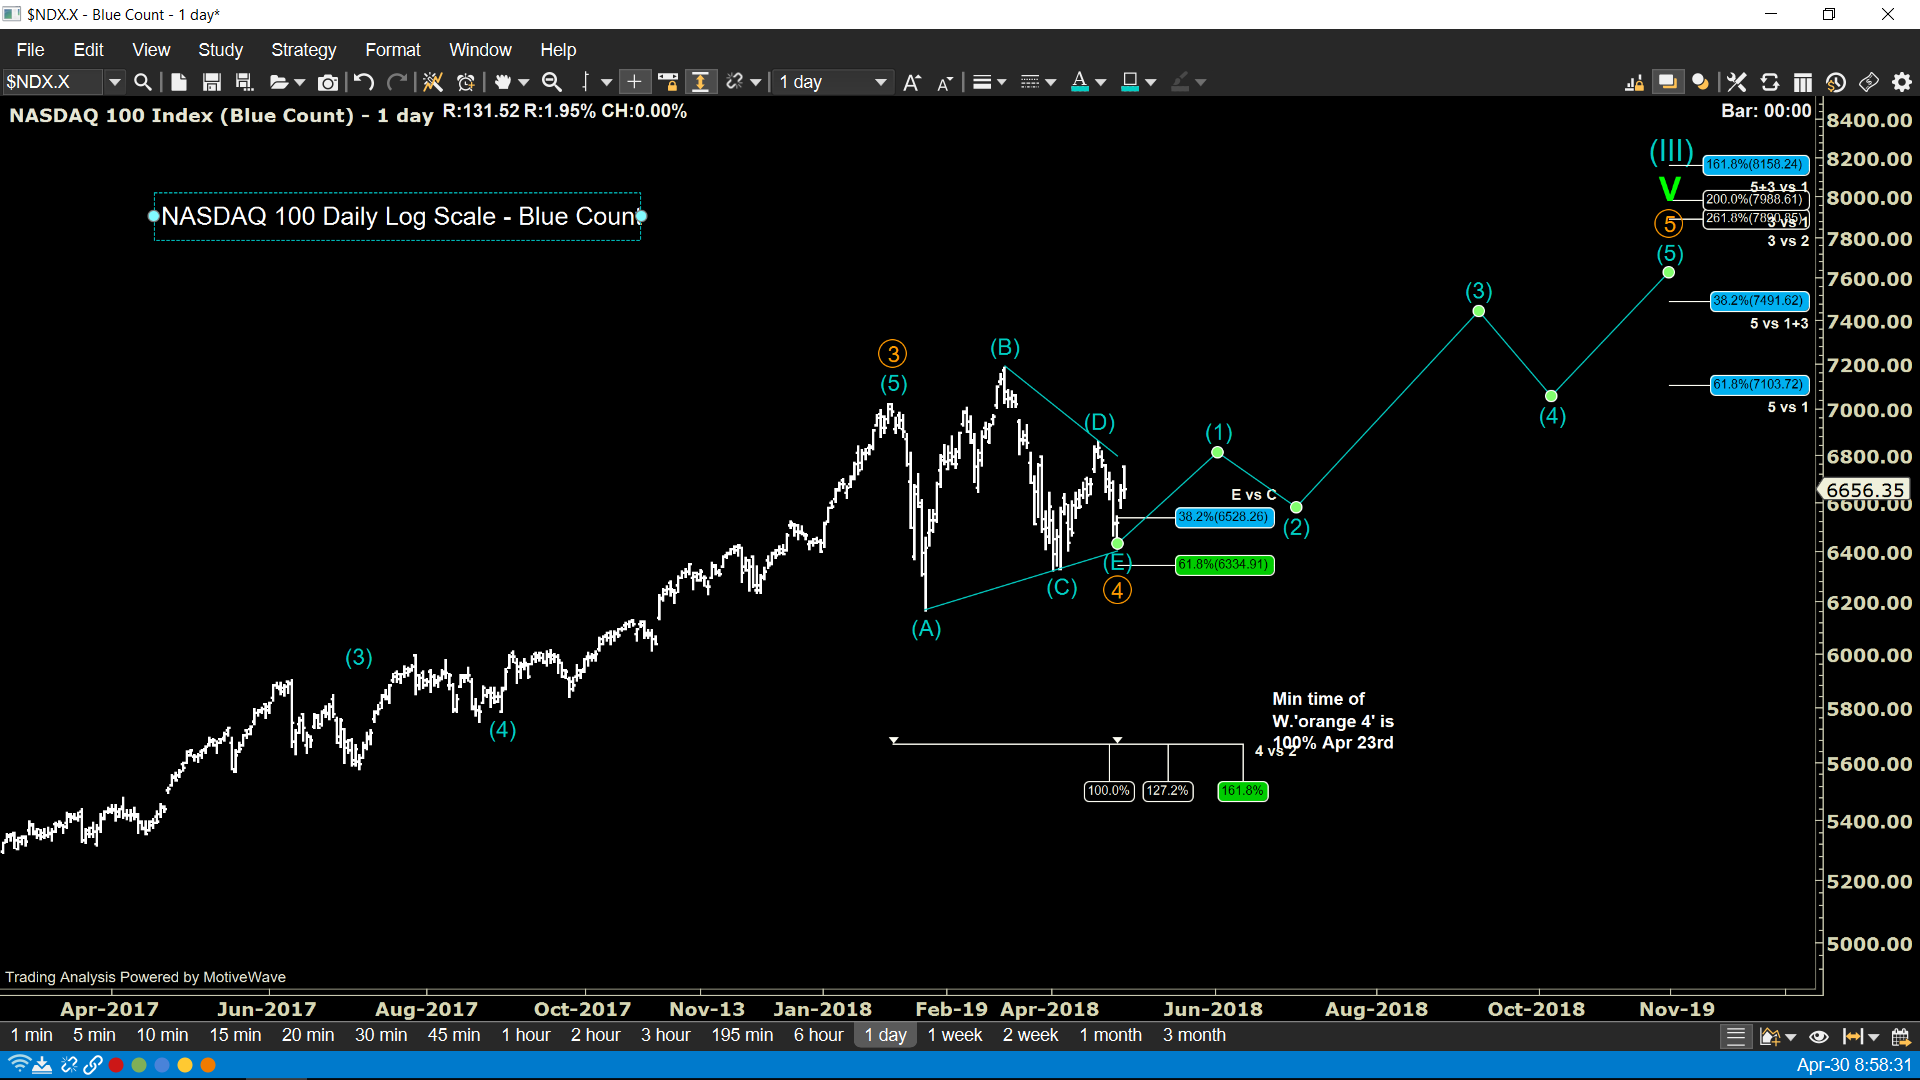
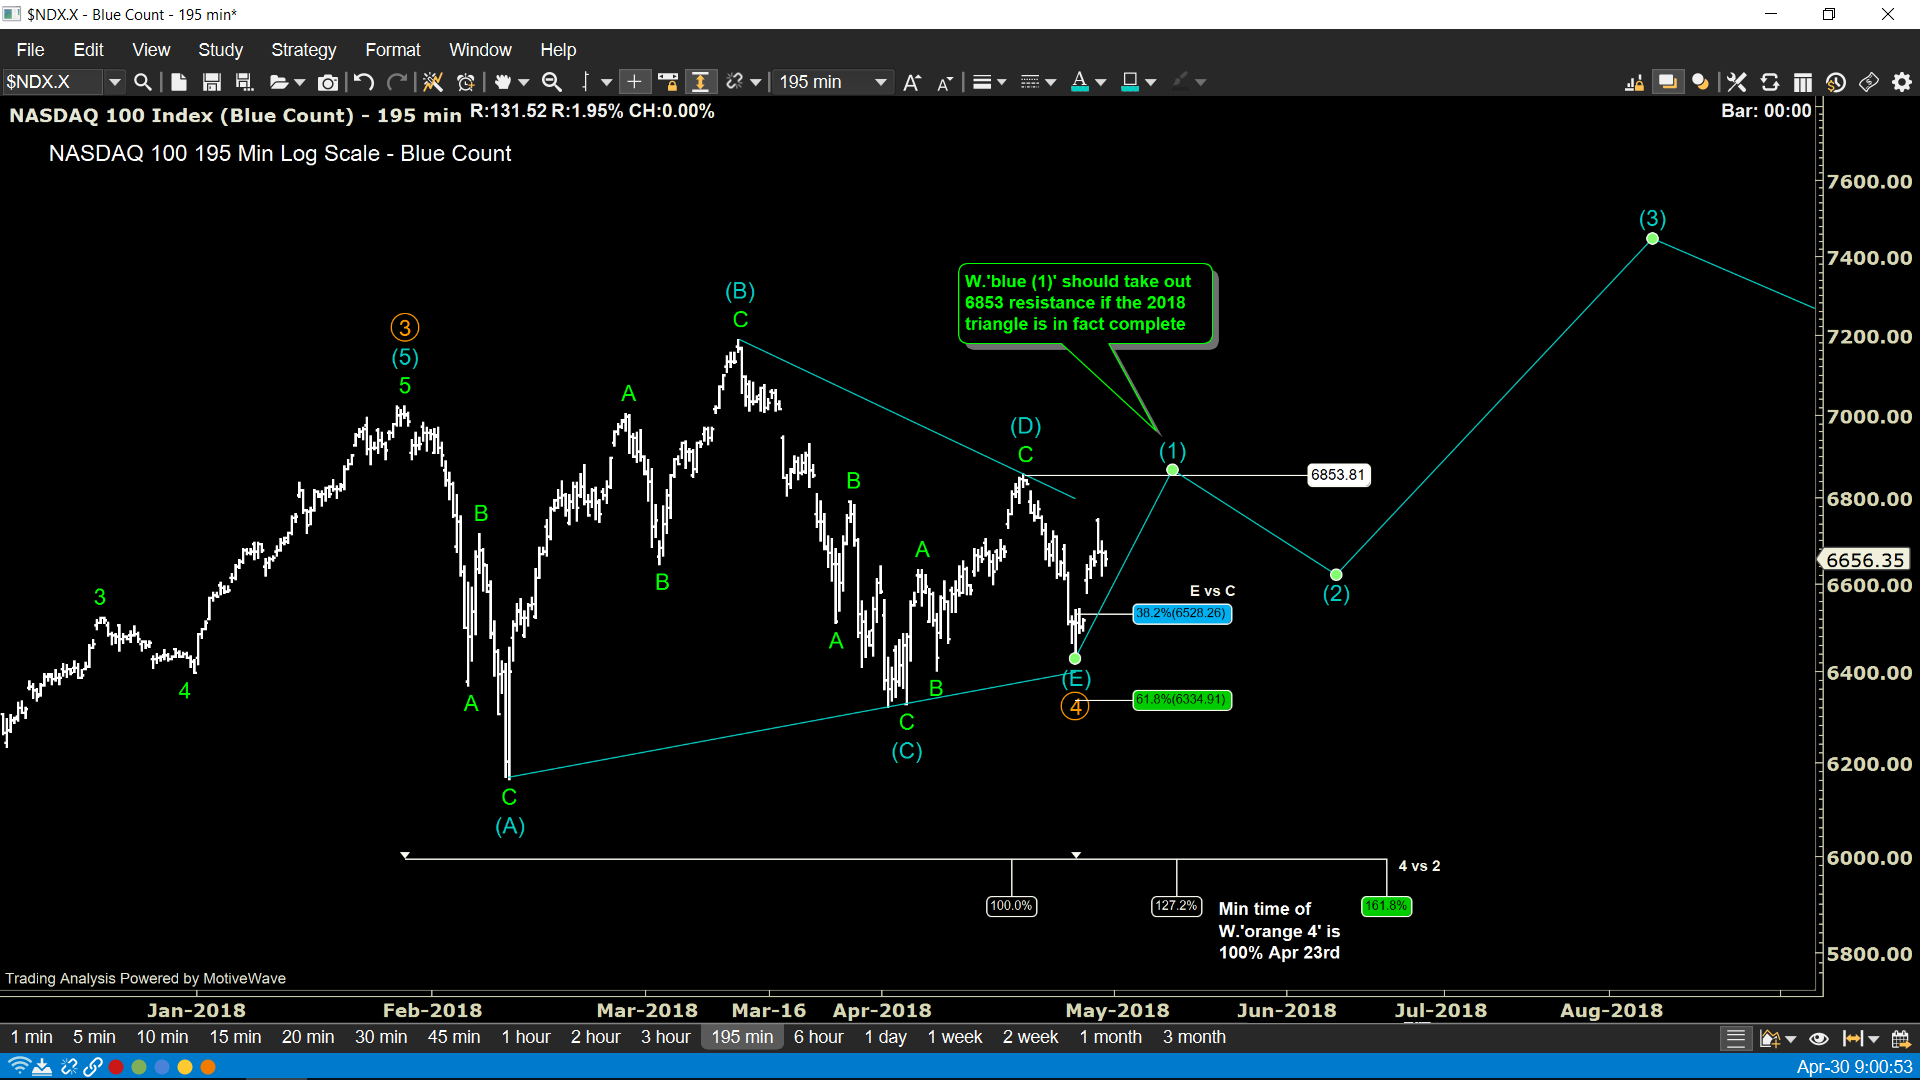
Is the 2018 triangle complete and we're about to break higher? 6853 resistance should be taken out to suggest the rally is underway. Keep in mind triangles usually last longer than you expect so there is no urgency to pay for option premium just yet to take us out of this triangle. March 27th - For now, I’m sticking with the conservative count of a sideways triangle in W.’orange circle 4’ that should last a minimum of April 23rd at the 100% W.4 vs W.2 time comparison. Ideal is the 161% on June 12th. A few have asked what about a more directional flat correction rather than the proposed triangle, but with the S&P’s shallow(er) B-wave retracement on March 12th, a flat correction is unlikely. Should we lose 6309 Fib support zone and then 6164 W. ‘blue (A)’ low, then the more dire bearish count kicks into gear. For now, focusing on getting from current levels of 6529 to 6309 with more money in our accounts then present levels. We’ll deal with the downside if we break down from there.
Major Time Frame
Medium Time Frame
Minor Time Frame
Market commentary:
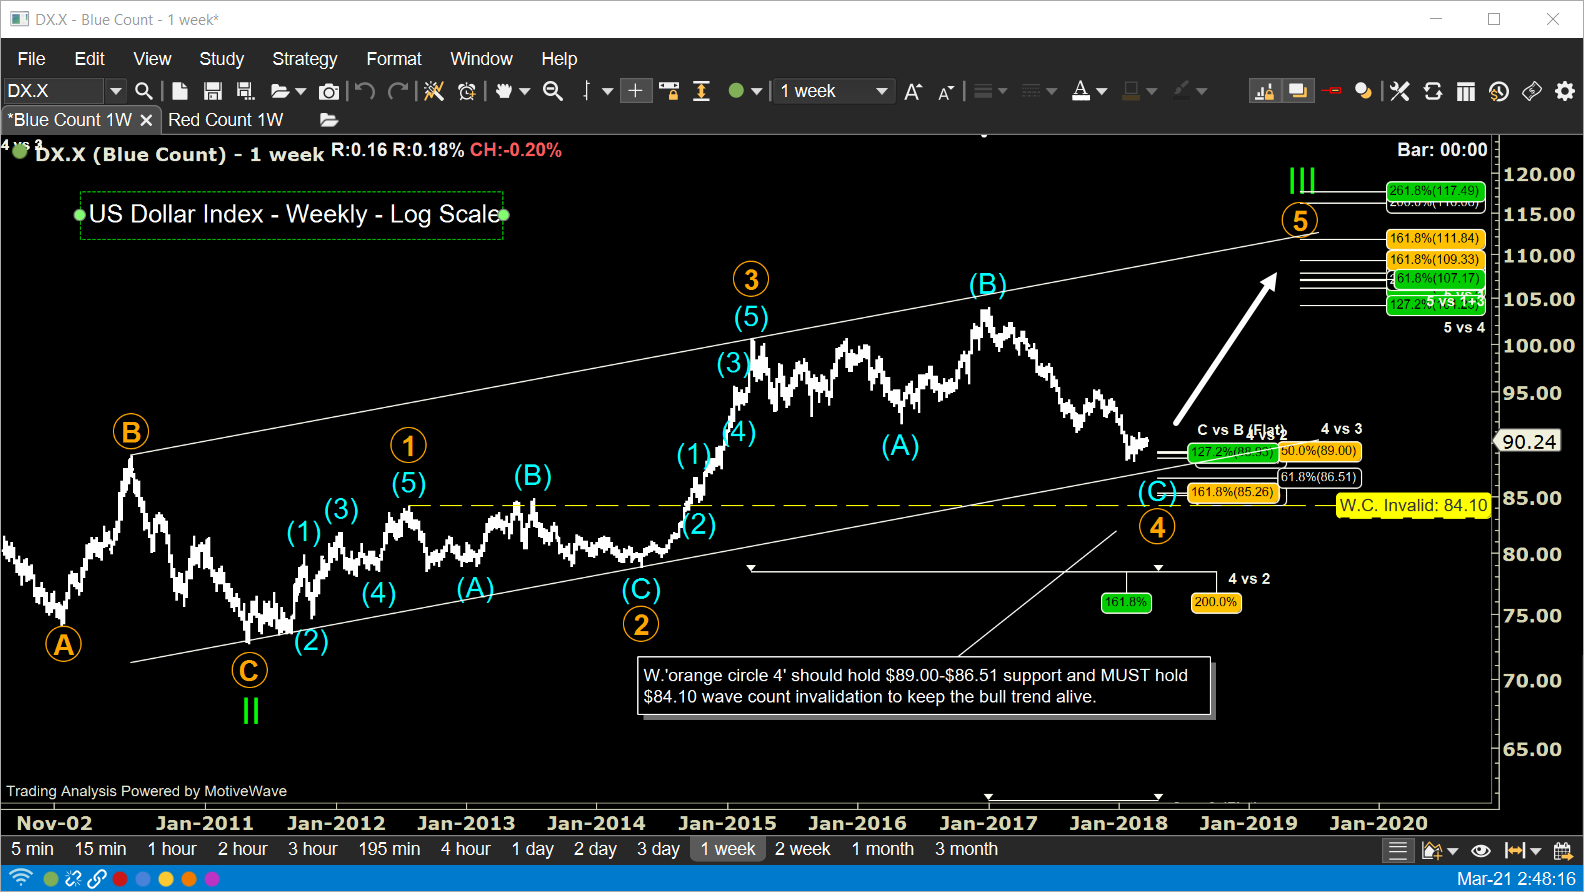
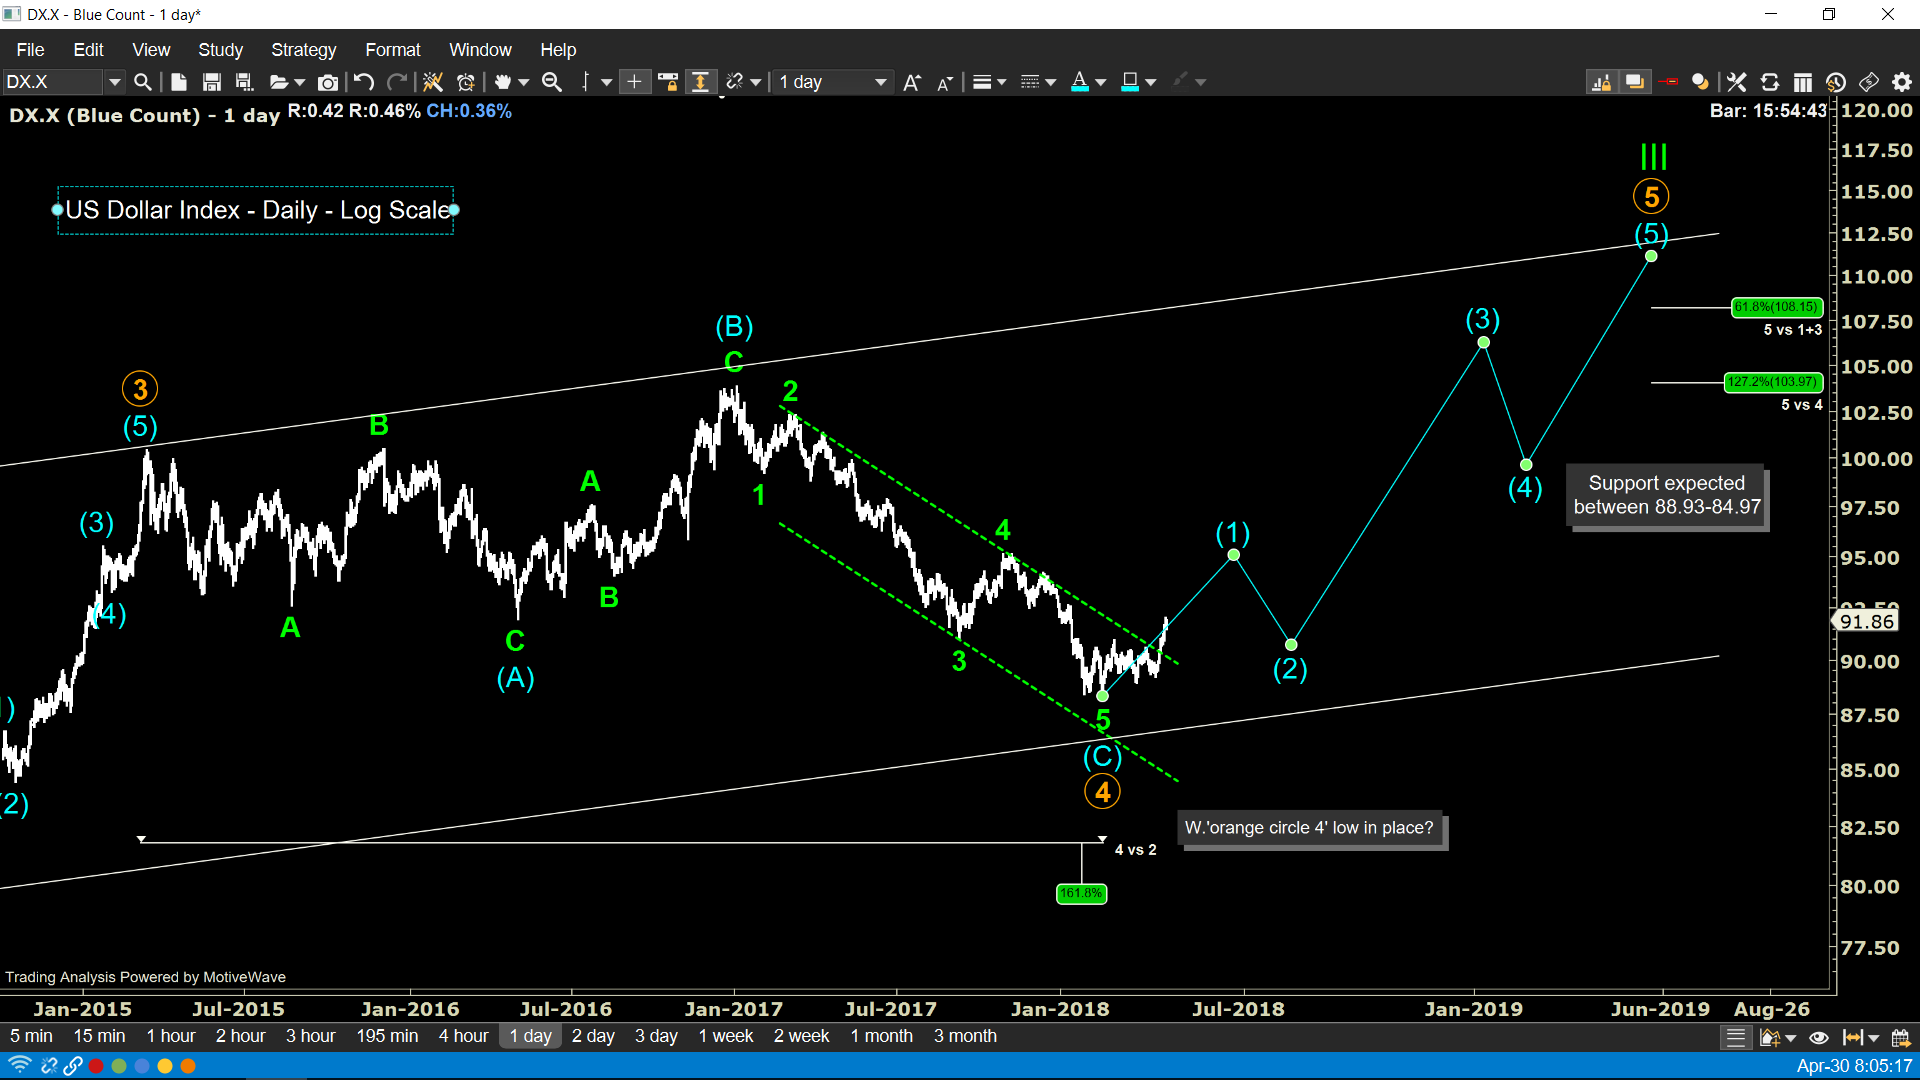
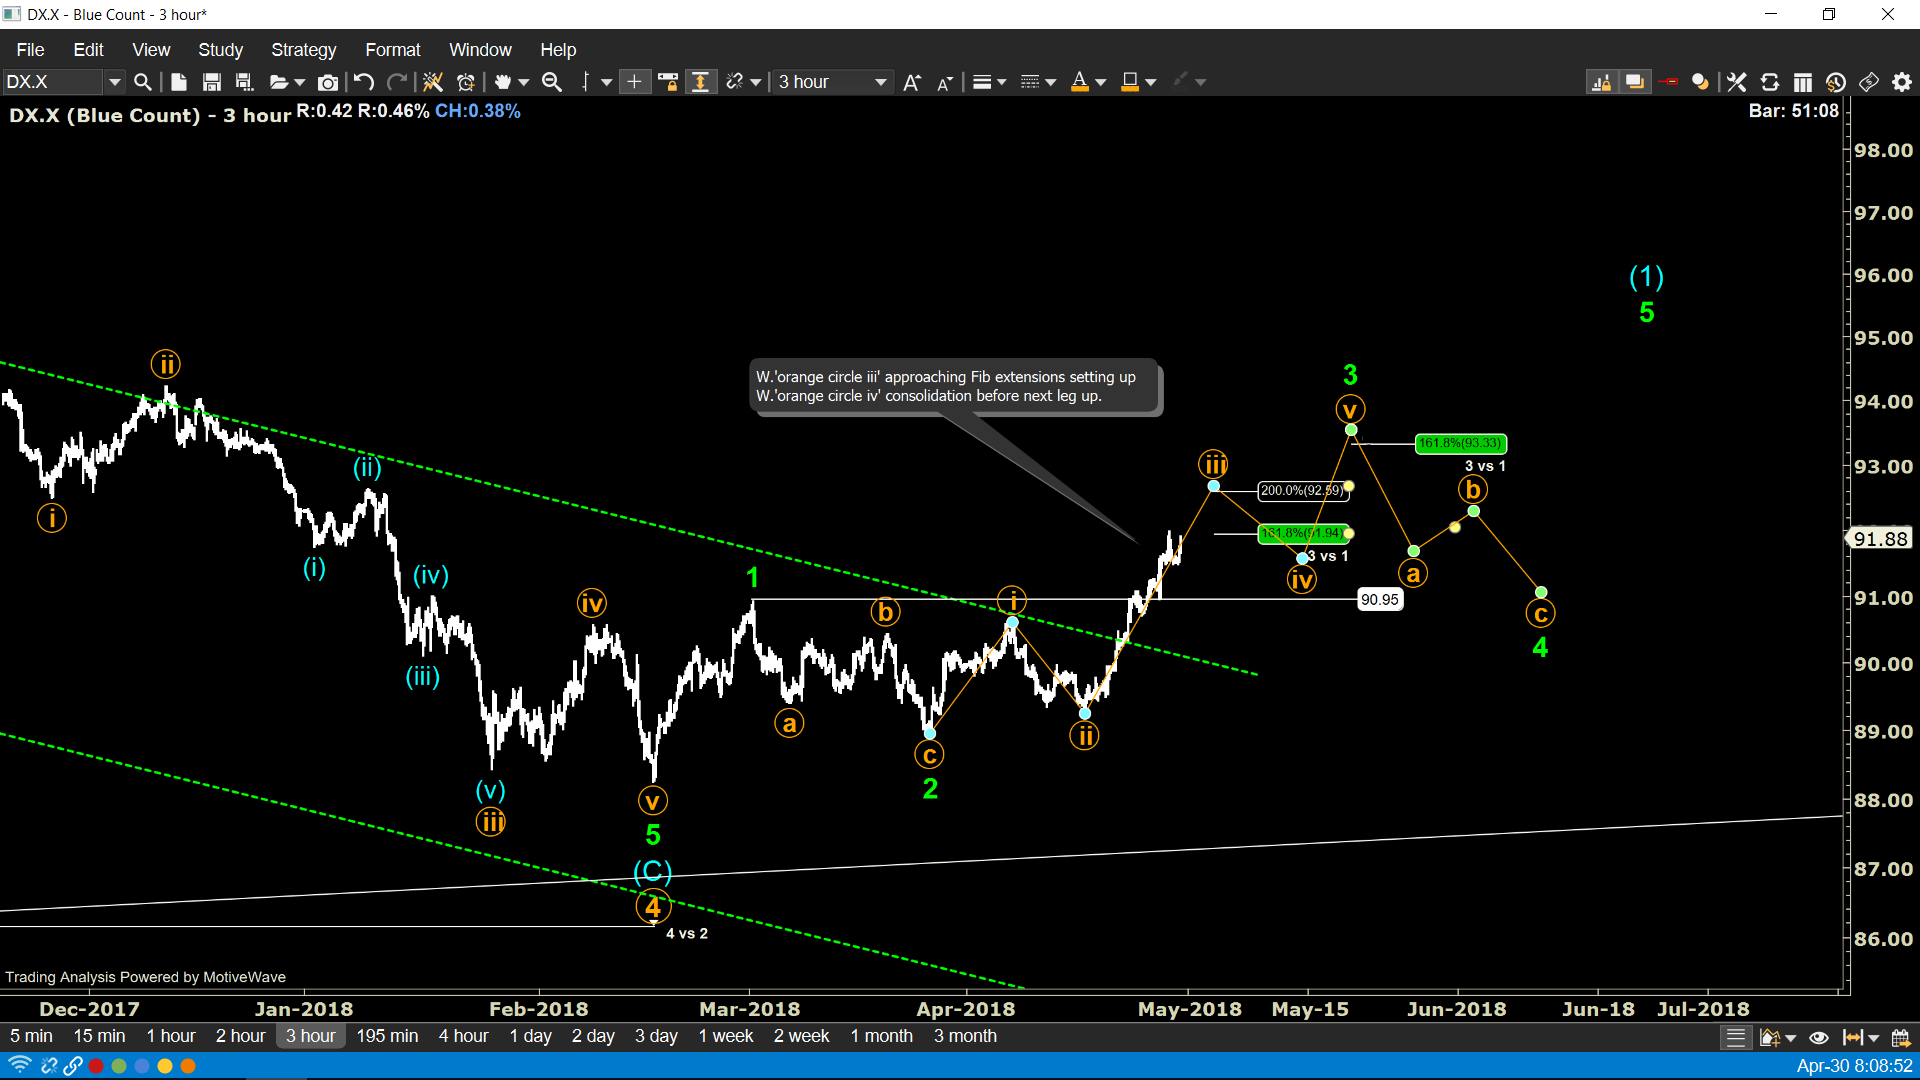
On the higher time frames we are going to operate under the assumption that W.'orange circle iv' is complete and we're moving higher in W.'orange circle v' targeting $105-$112 in the next 12-18 months. To the Minor Time Frame W.'orange circle iii' approaching Fib extensions setting up W.'orange circle iv' consolidation before next leg up.
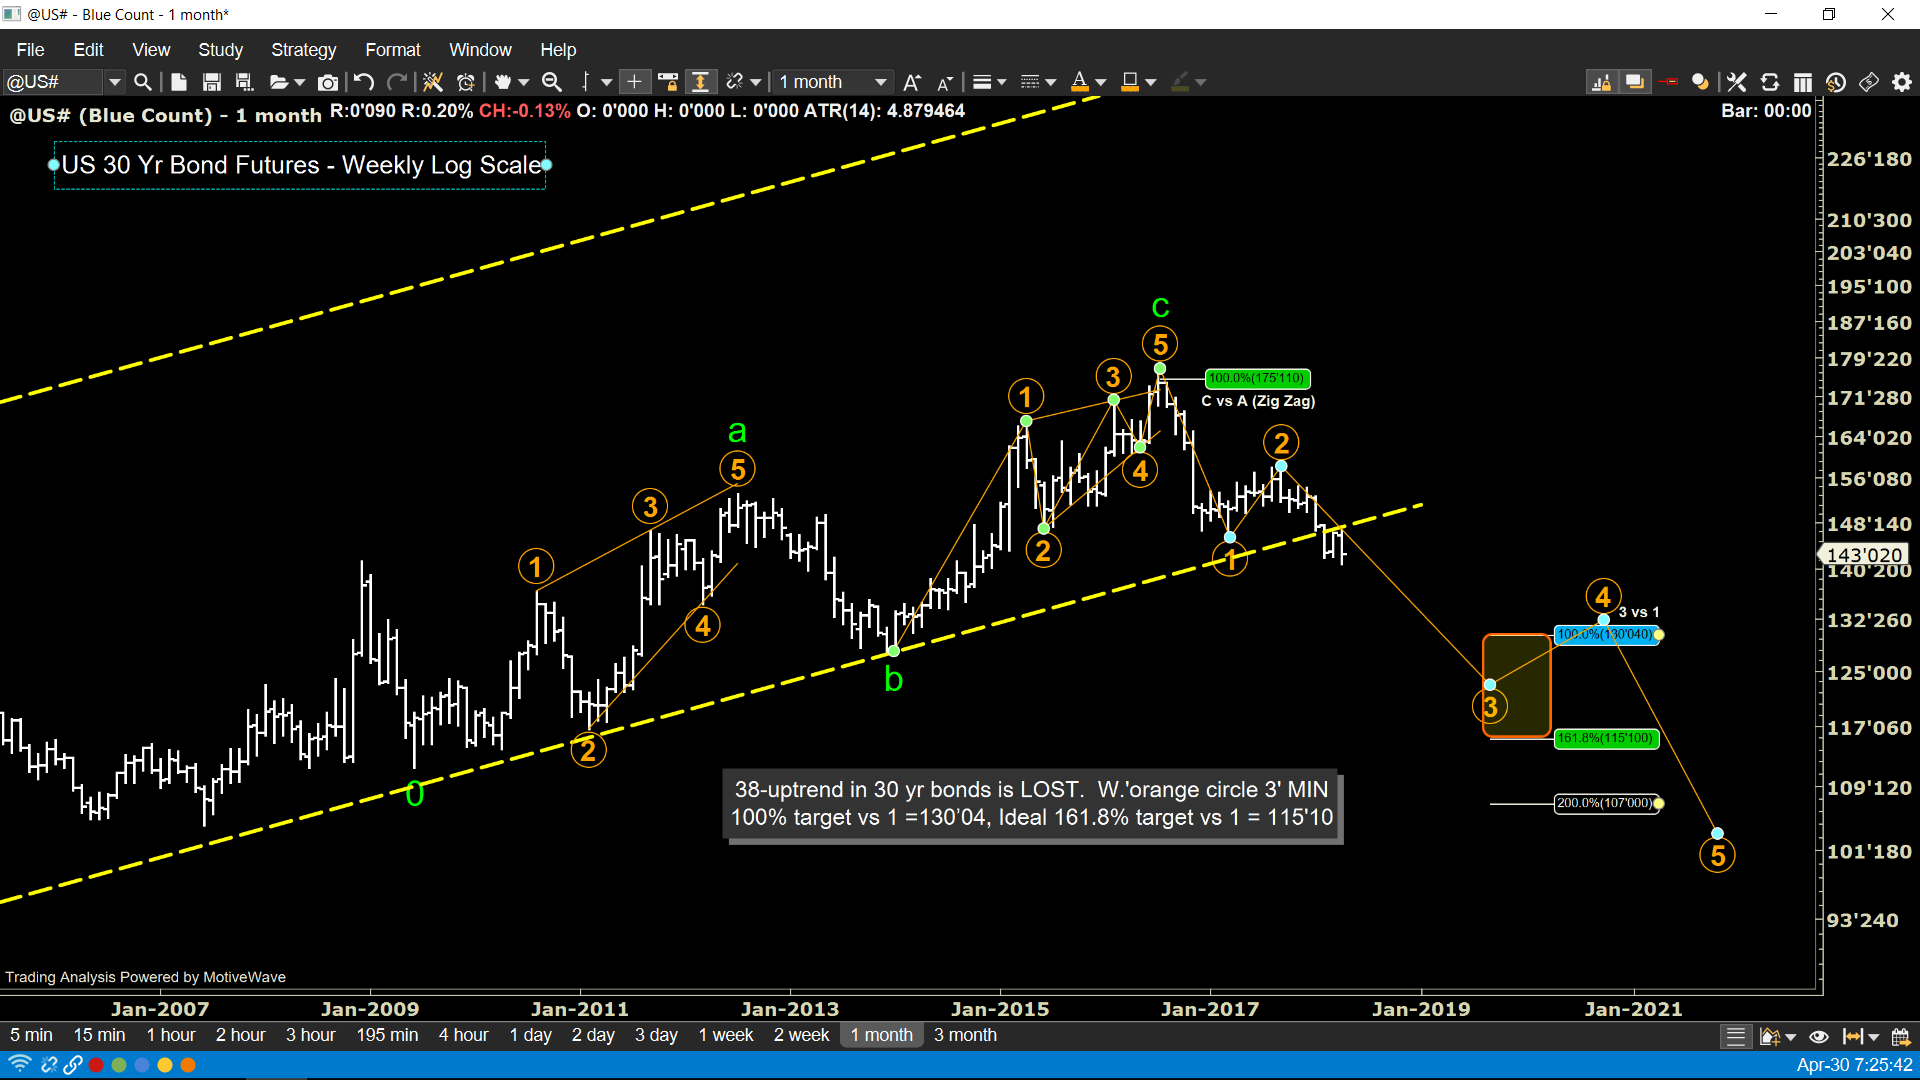
Major Time Frame
Medium Time Frame
Minor Time Frame
Market commentary:
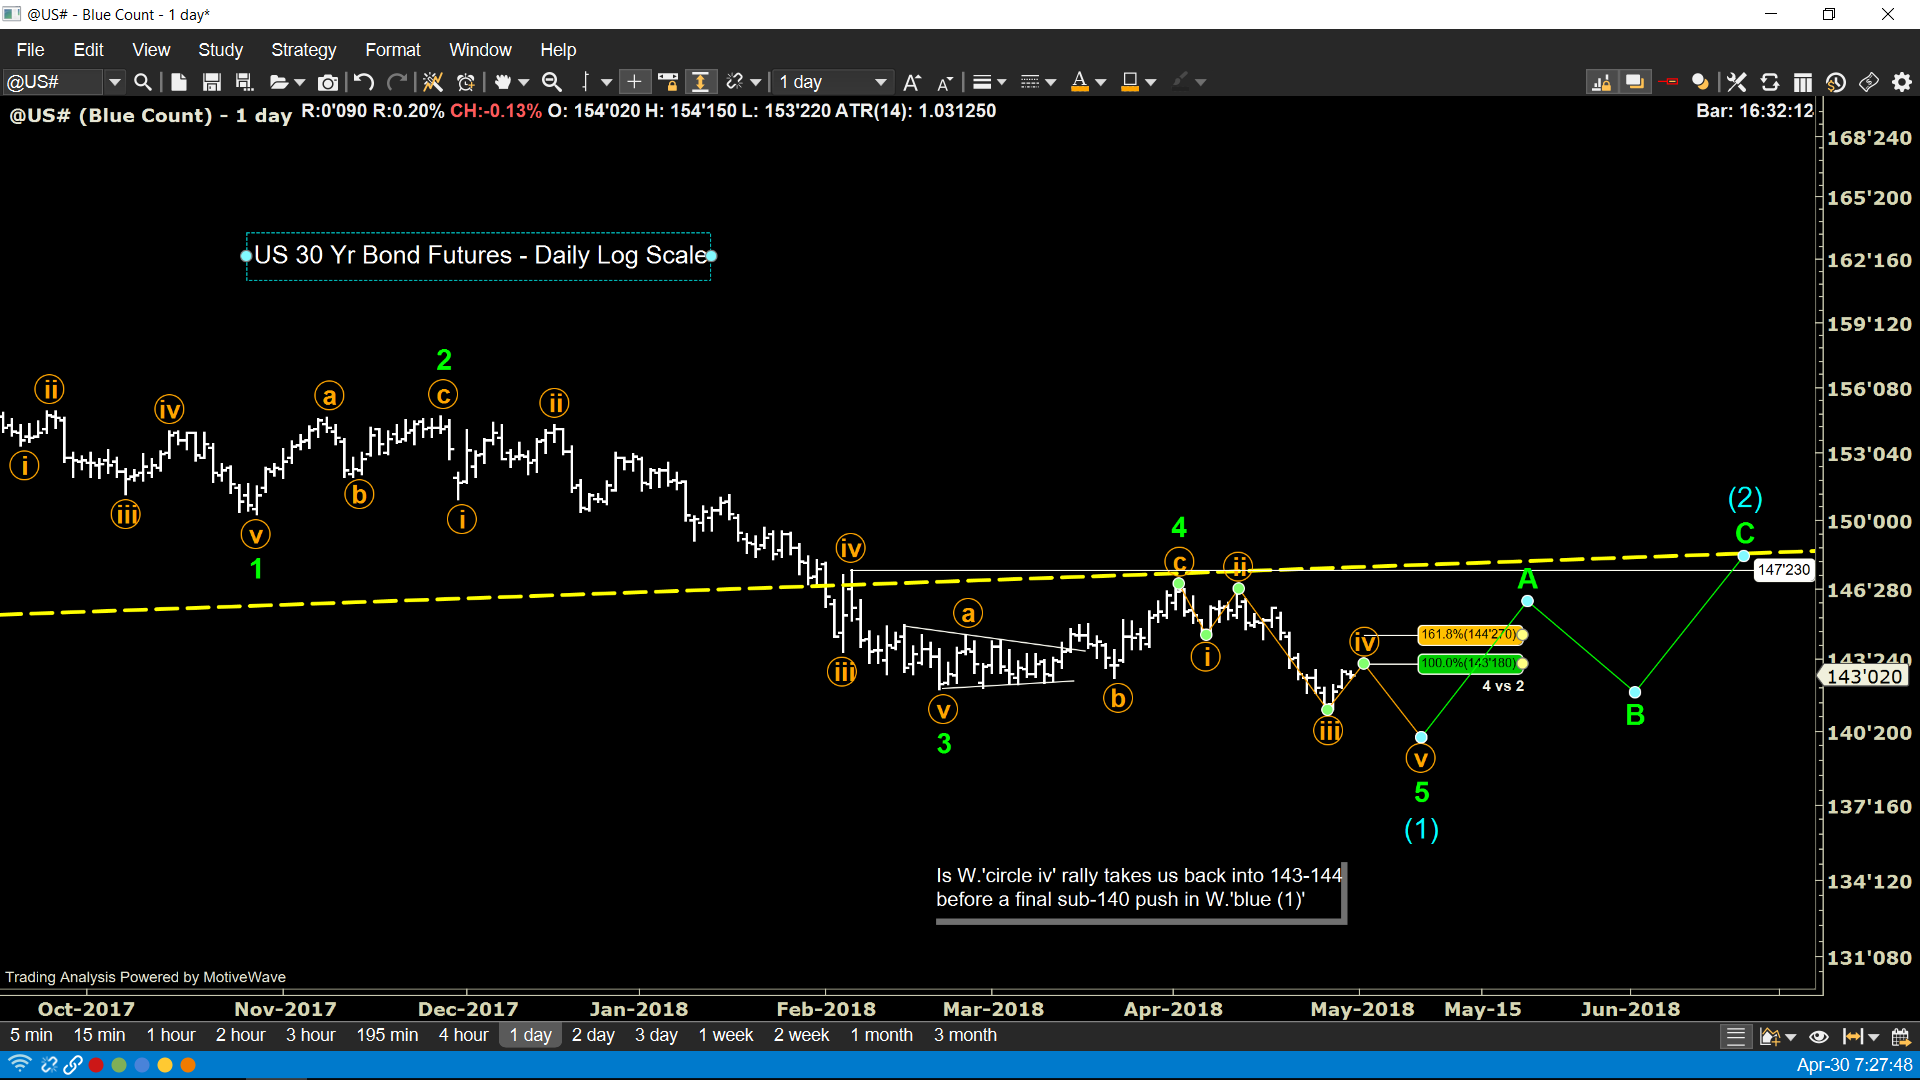
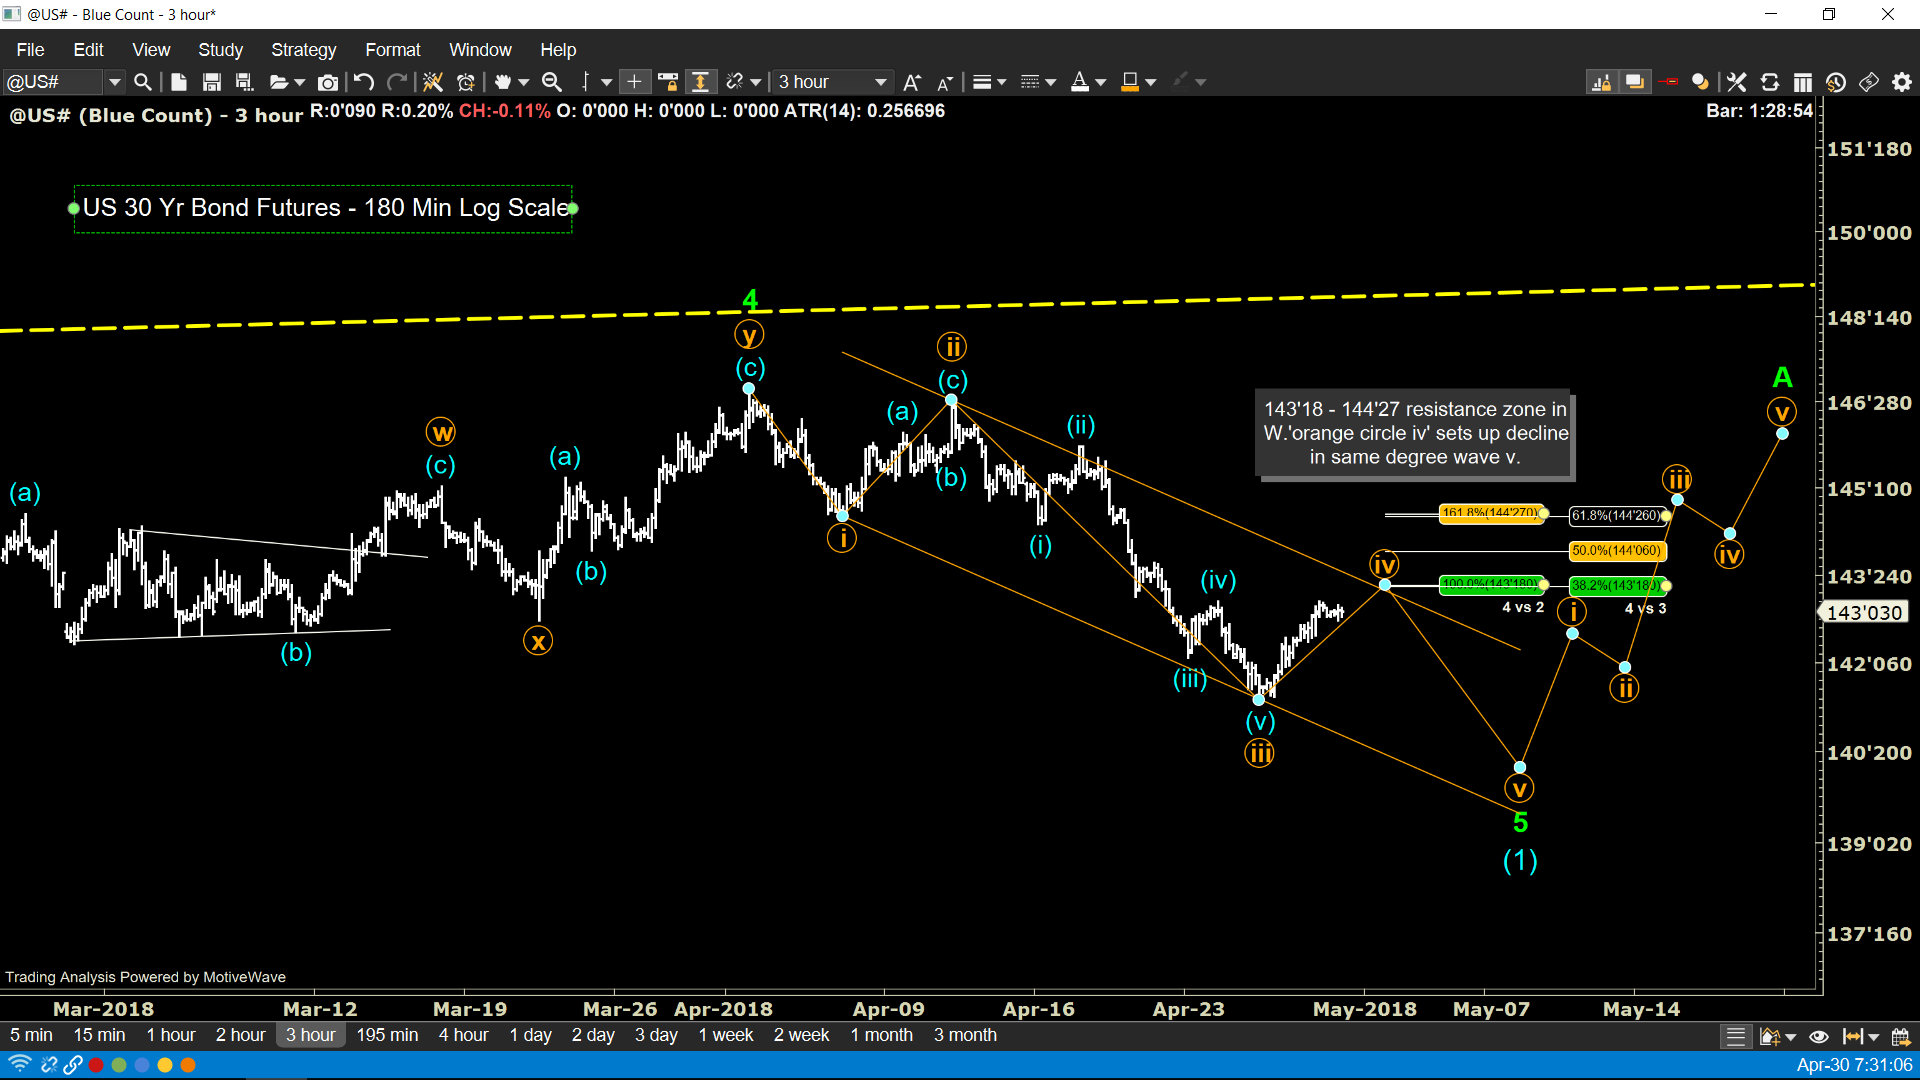
Minor Time Frame - Looking for shorting opportunities here for one final push lower below 140 before a counter-trend rally beings. 143'18 - 144'27 resistance zone in W.'orange circle iv' sets up decline in same degree wave v.
Major Time Frame
Medium Time Frame
Minor Time Frame
Market commentary:
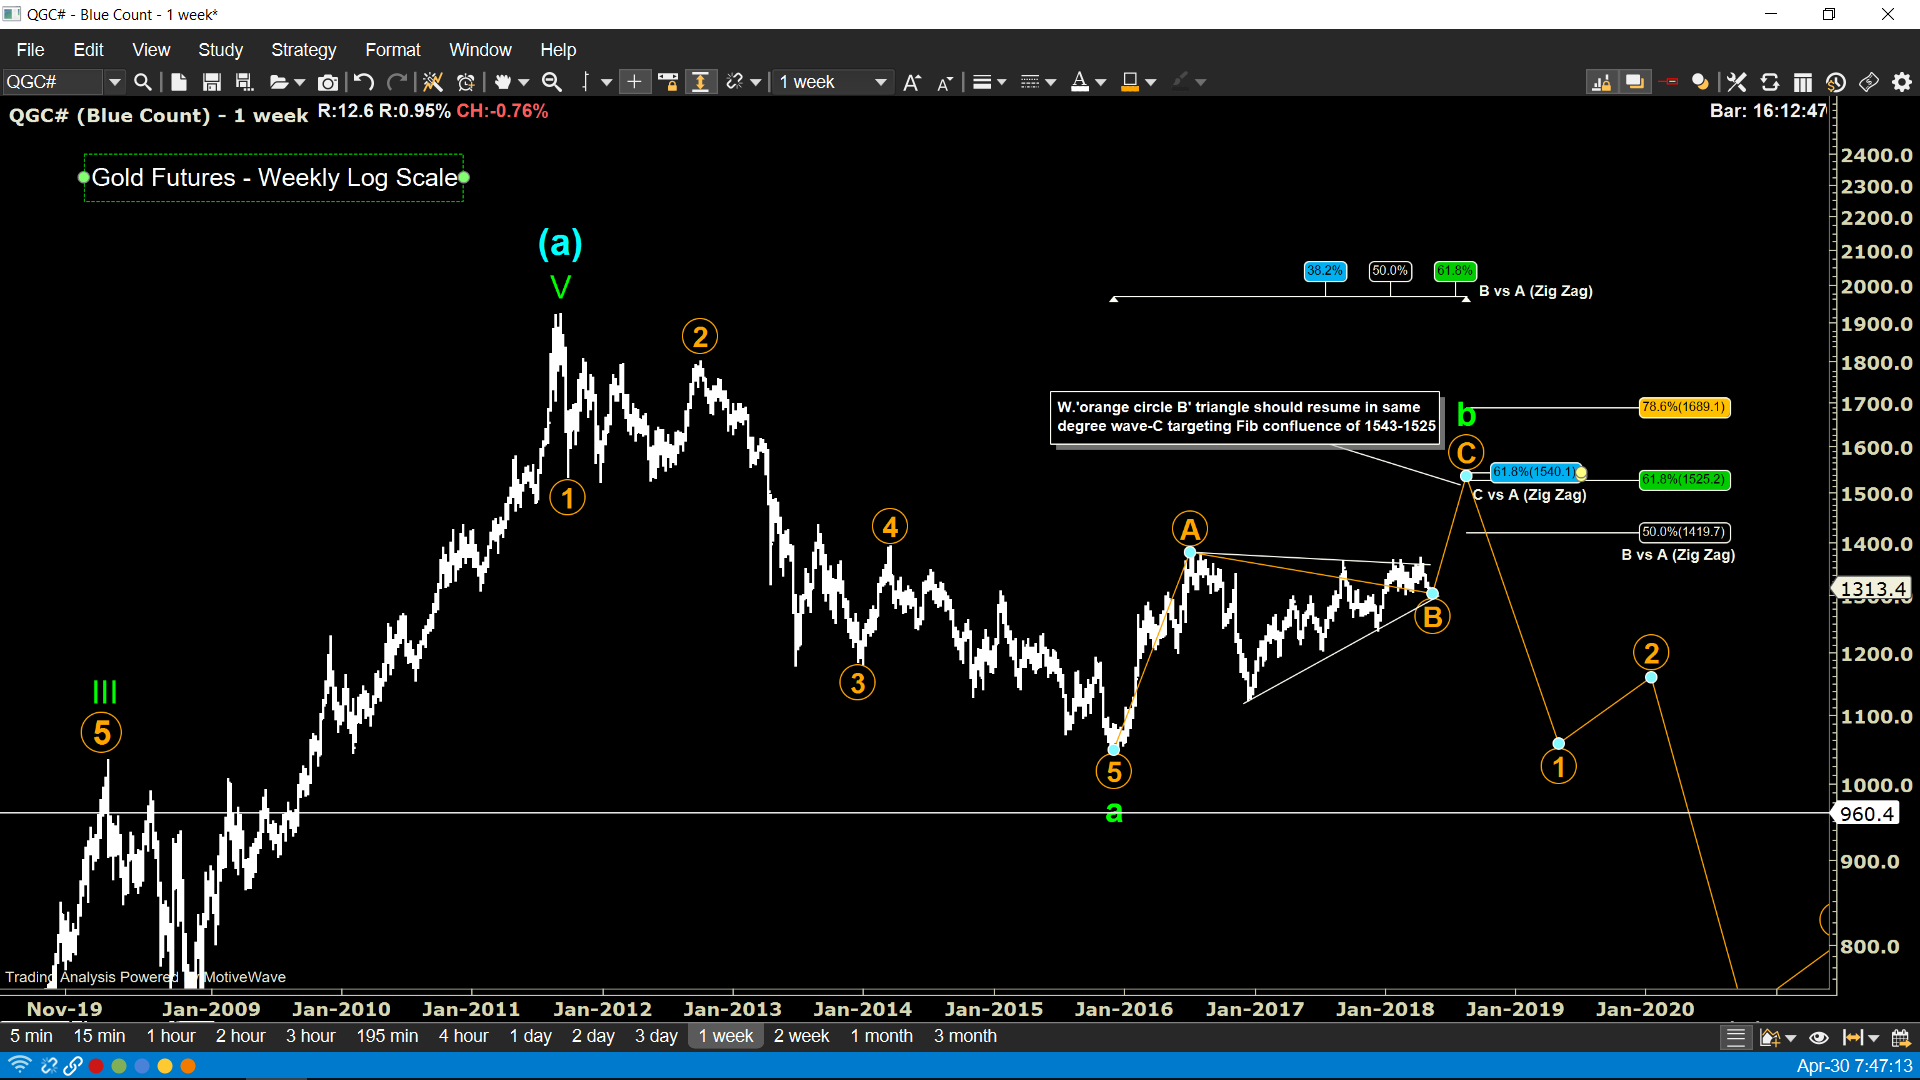
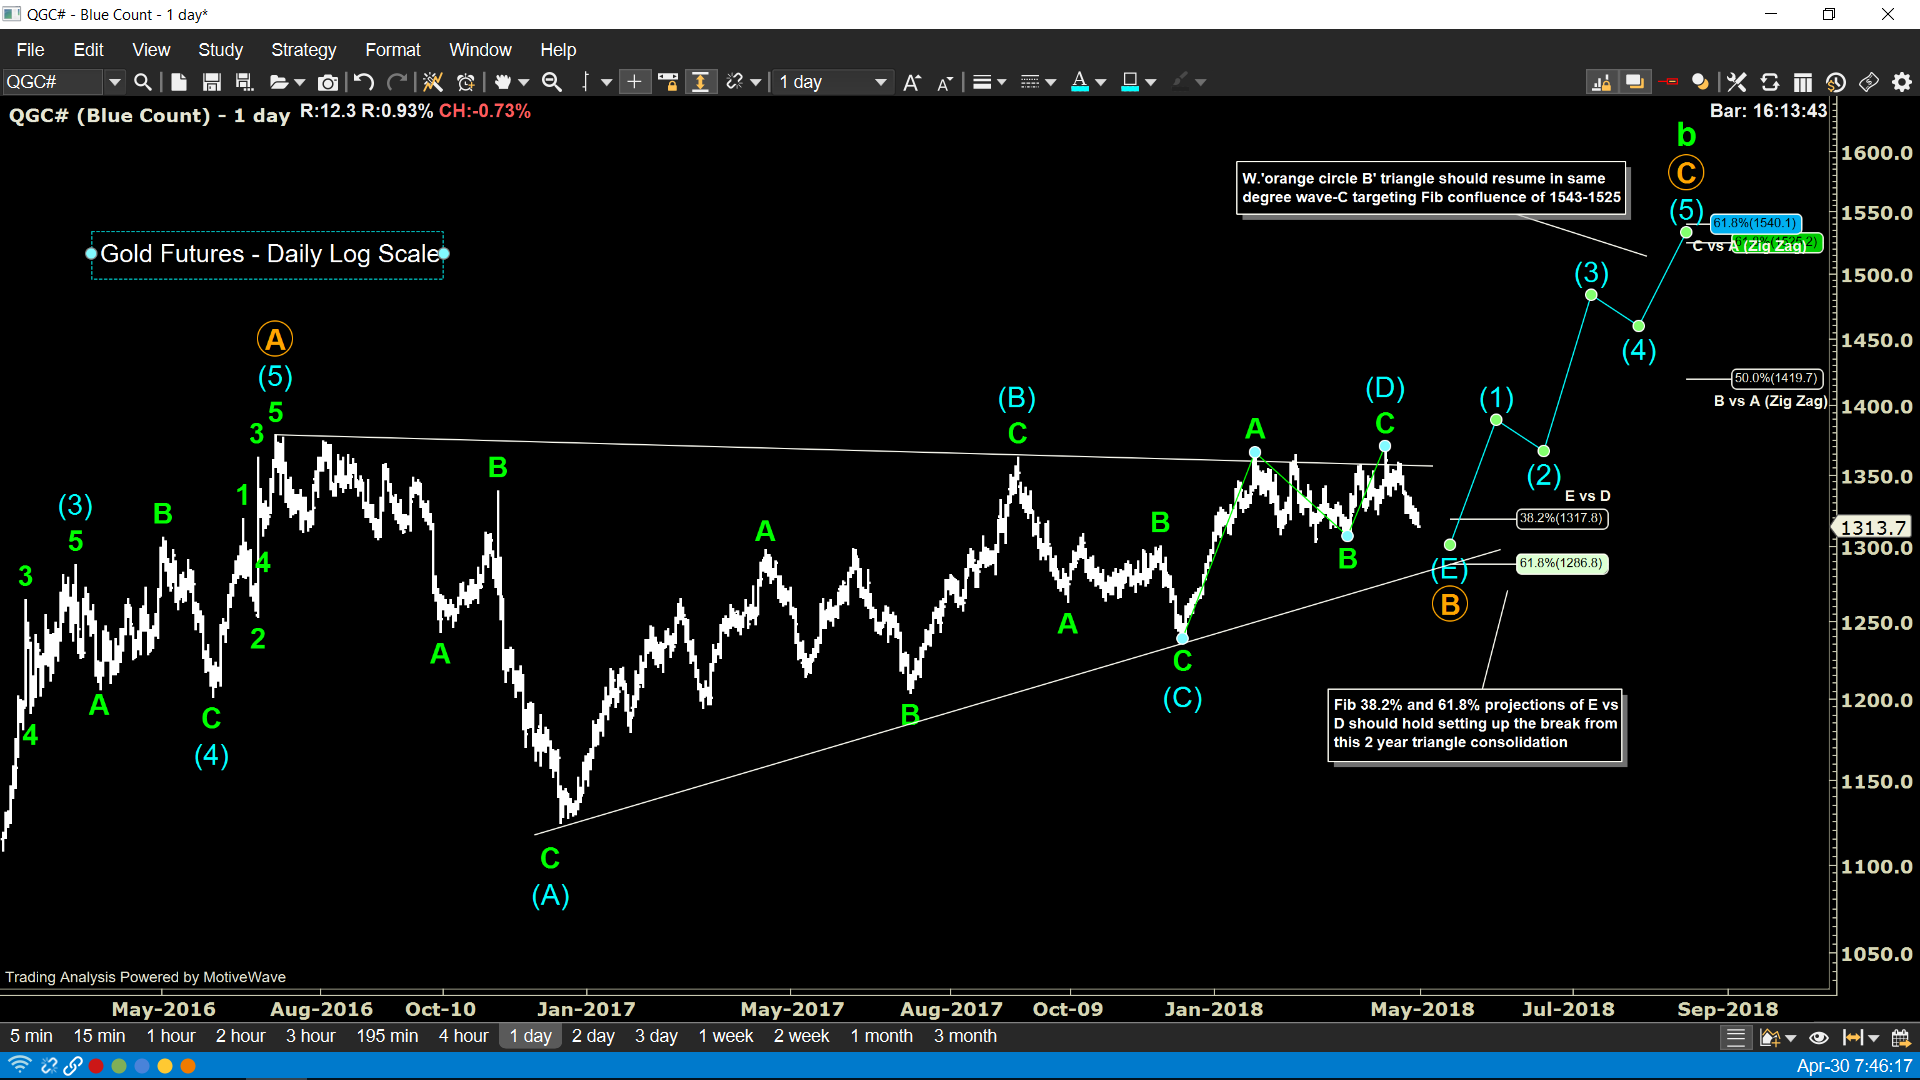
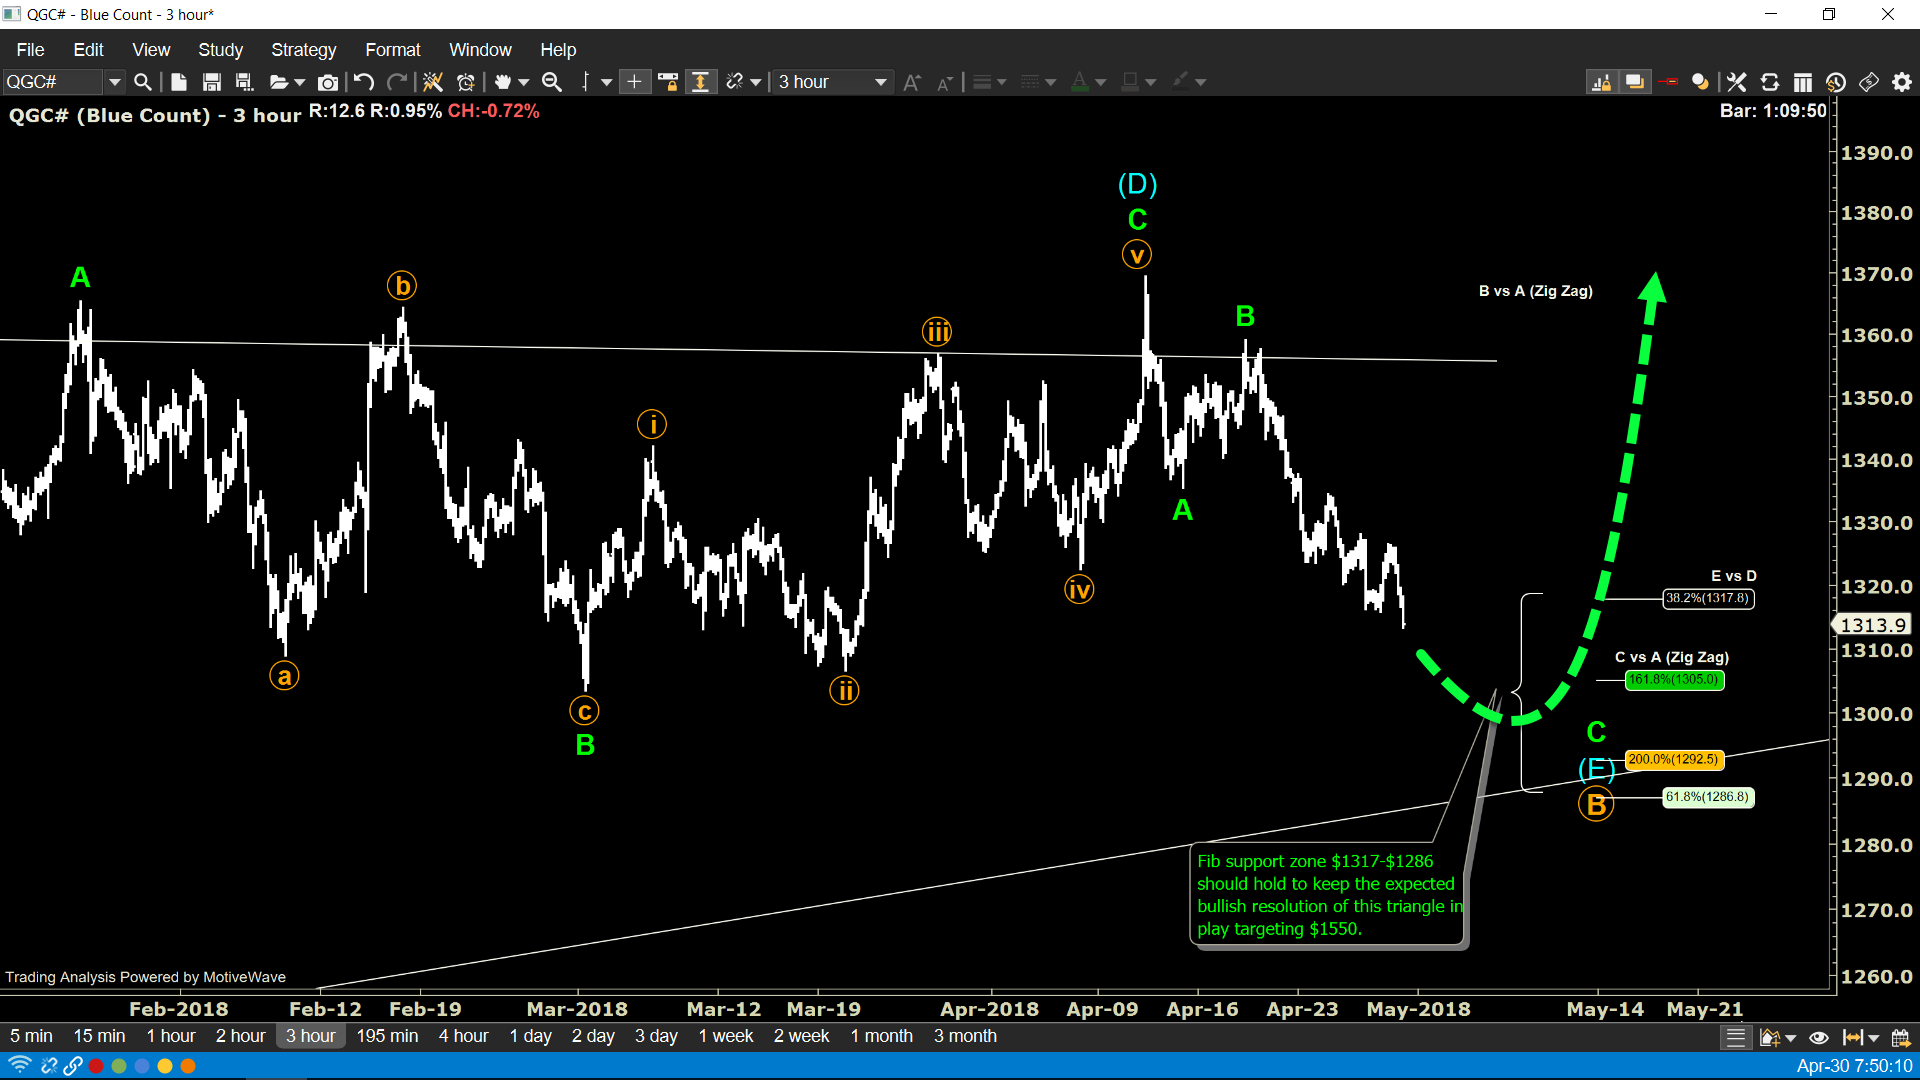
Updated: Well, it's do-or-die for this triangle that's been in play since Jan '16. Our best is higher while $1317-$1286 Fib support holds on the Minor Time frame. We are positioned long for a move towards $1550 via a bear call ladder (see trade desk).
Major Time Frame
Medium Time Frame
Minor Time Frame
Market commentary:
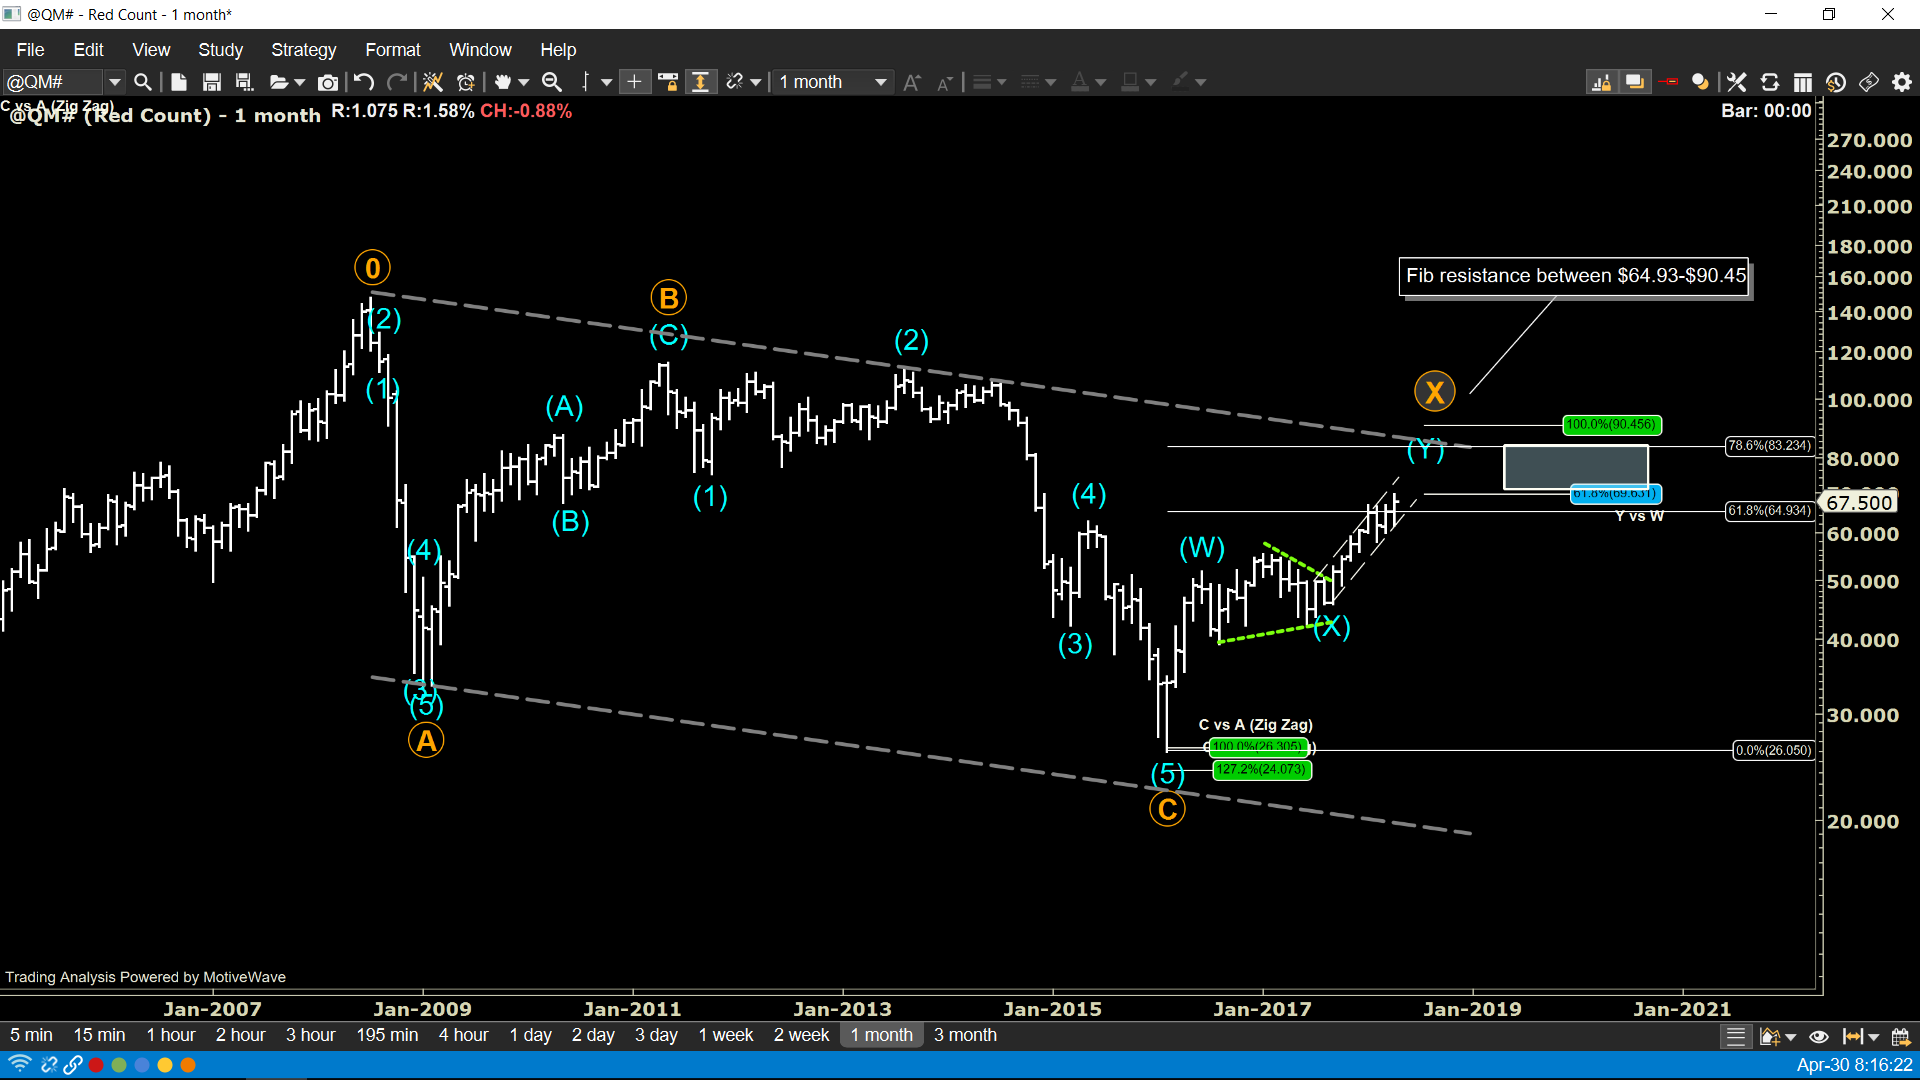
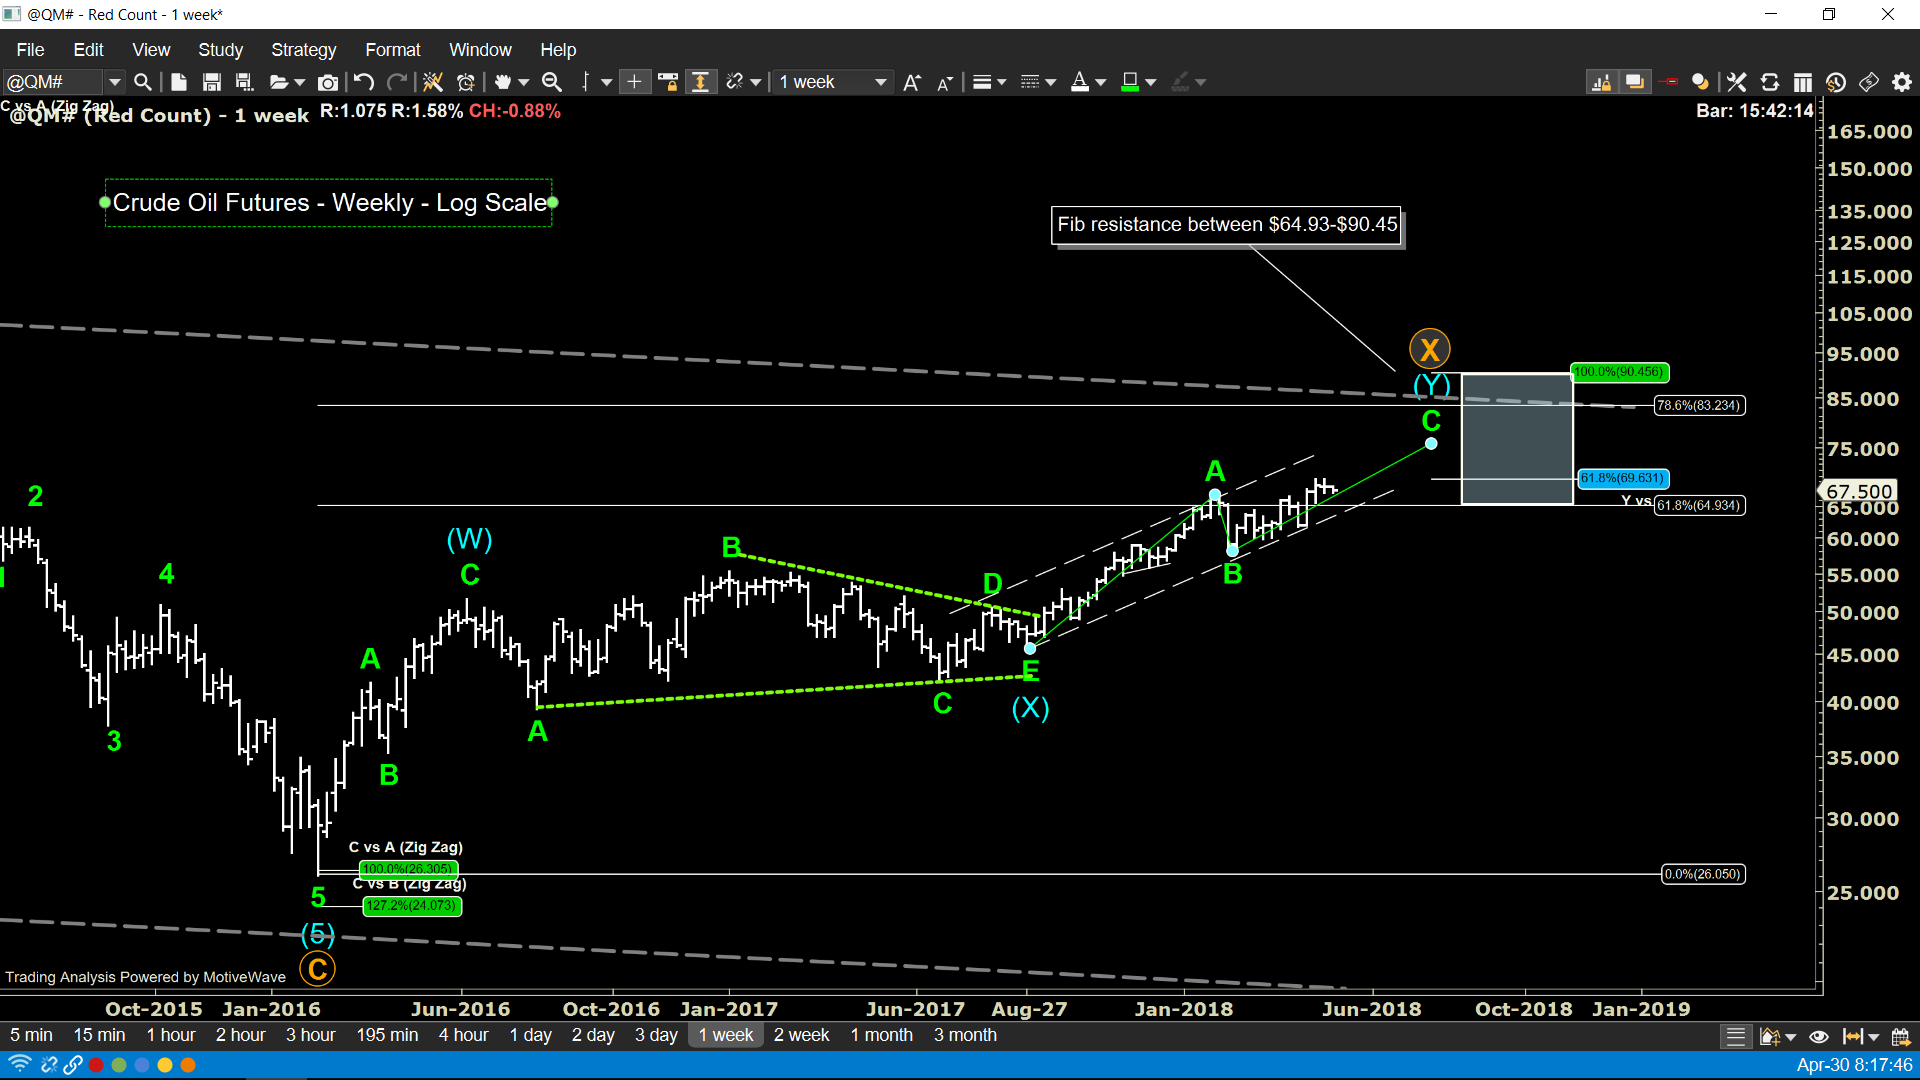
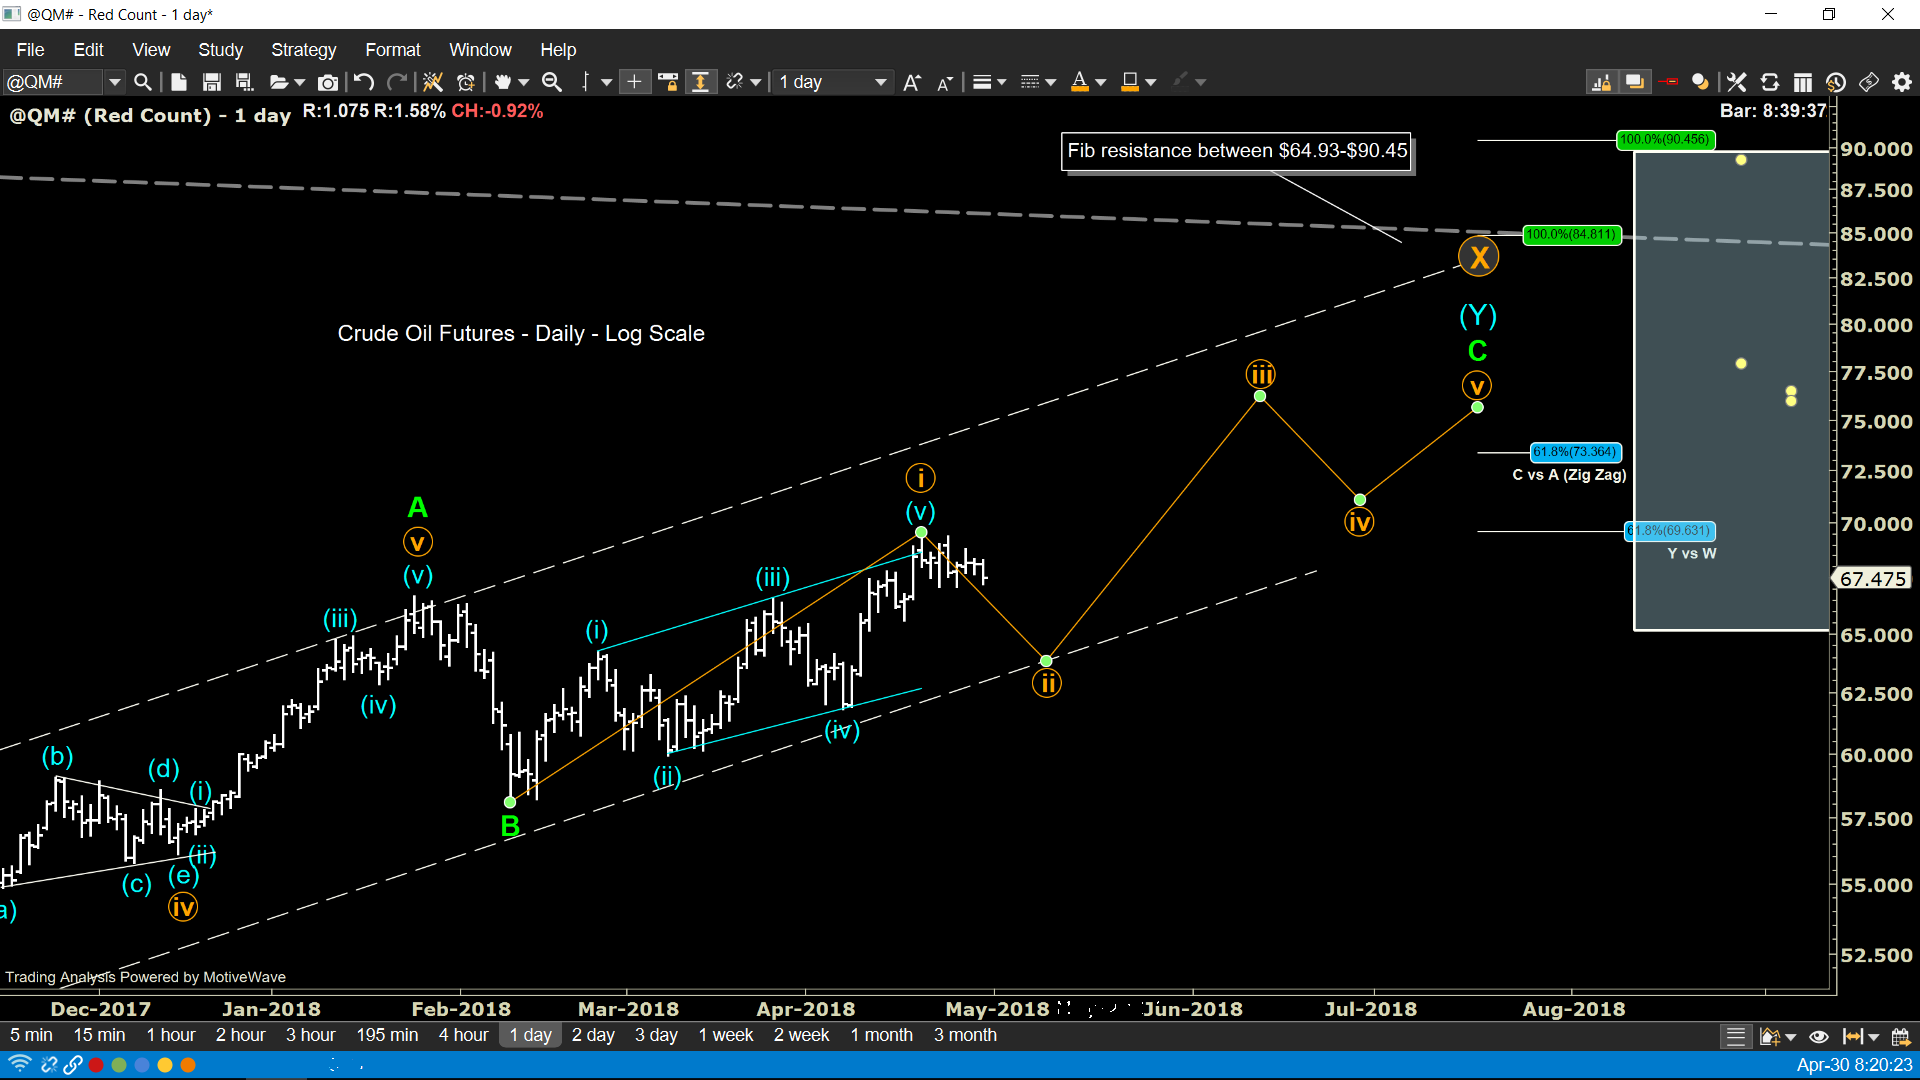
On the Minor Time Frame W.'orange circle i' rally looking complete via a leading diagonal setting up W.'orange circle ii' decline. Ultimately, as the Major and Medium time frames show, we should be headed into the $83-$90.50 upper Fib resistance zone.
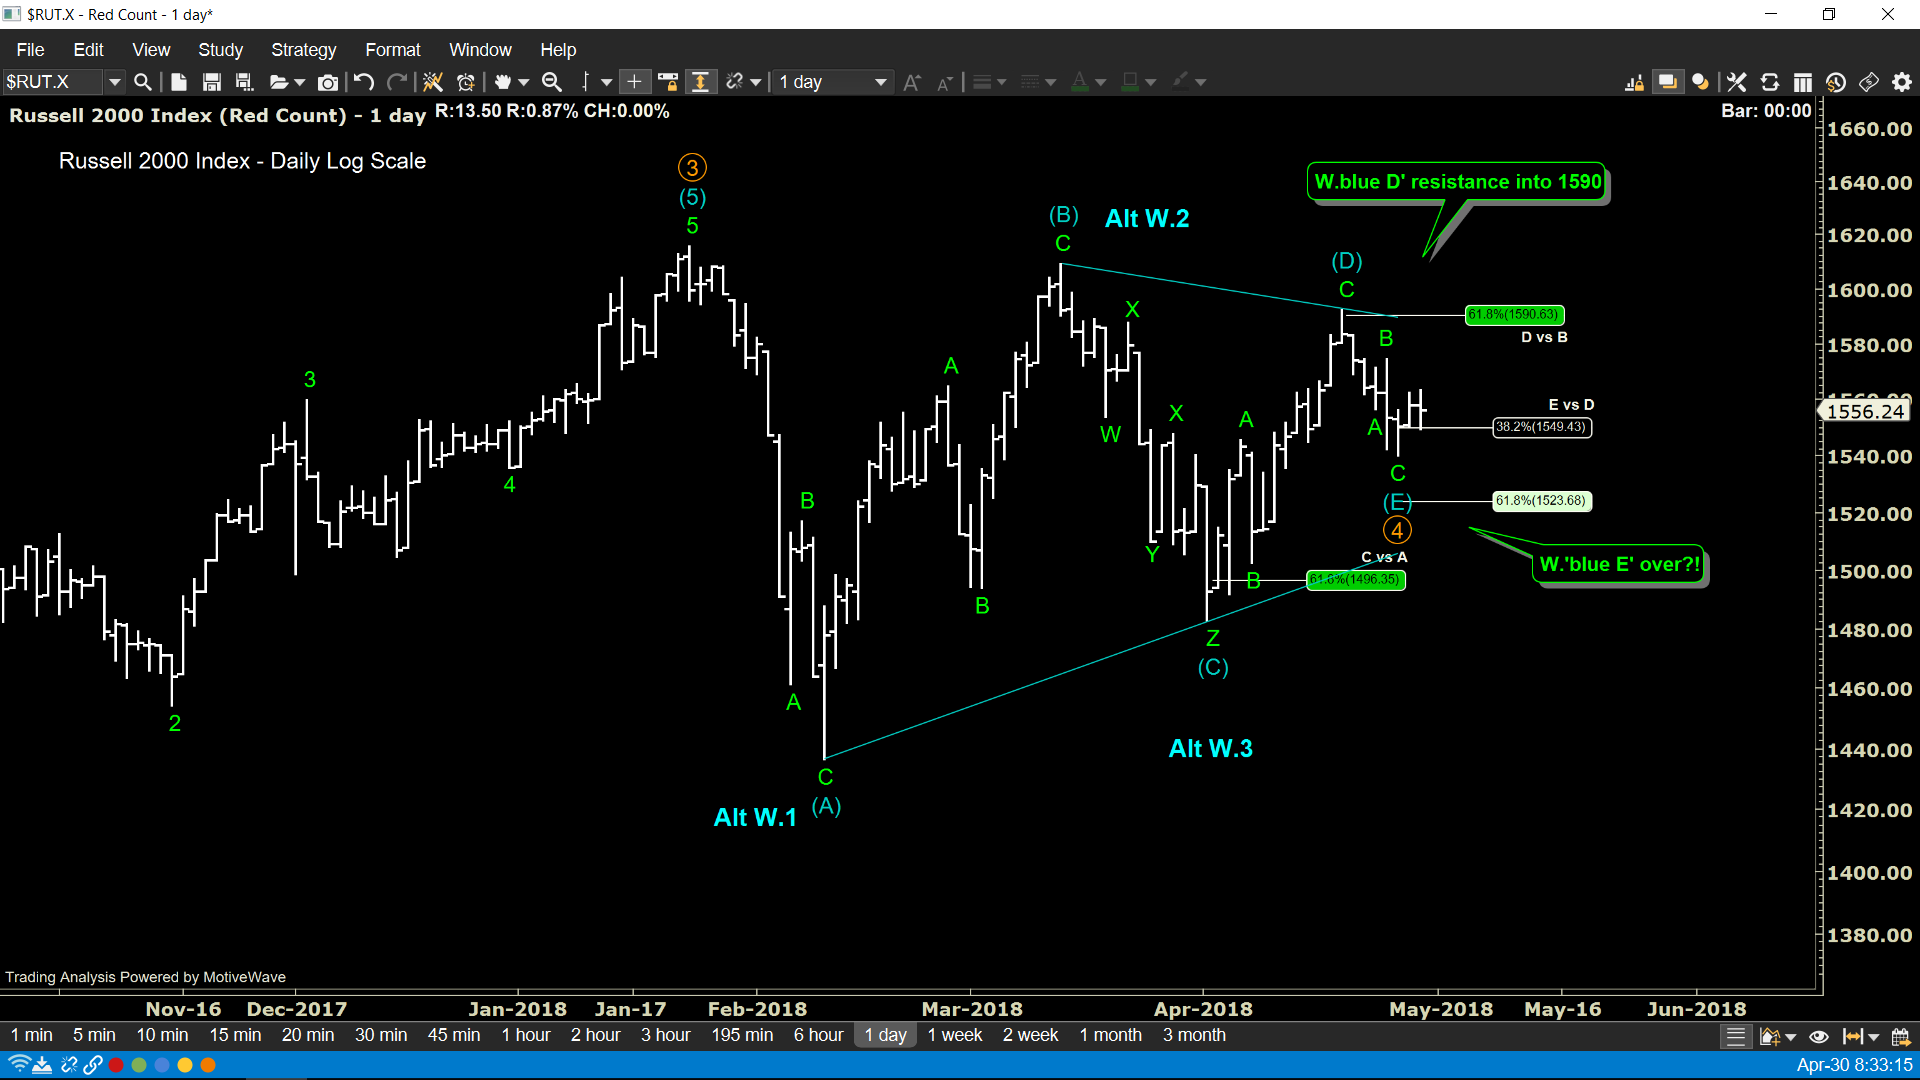
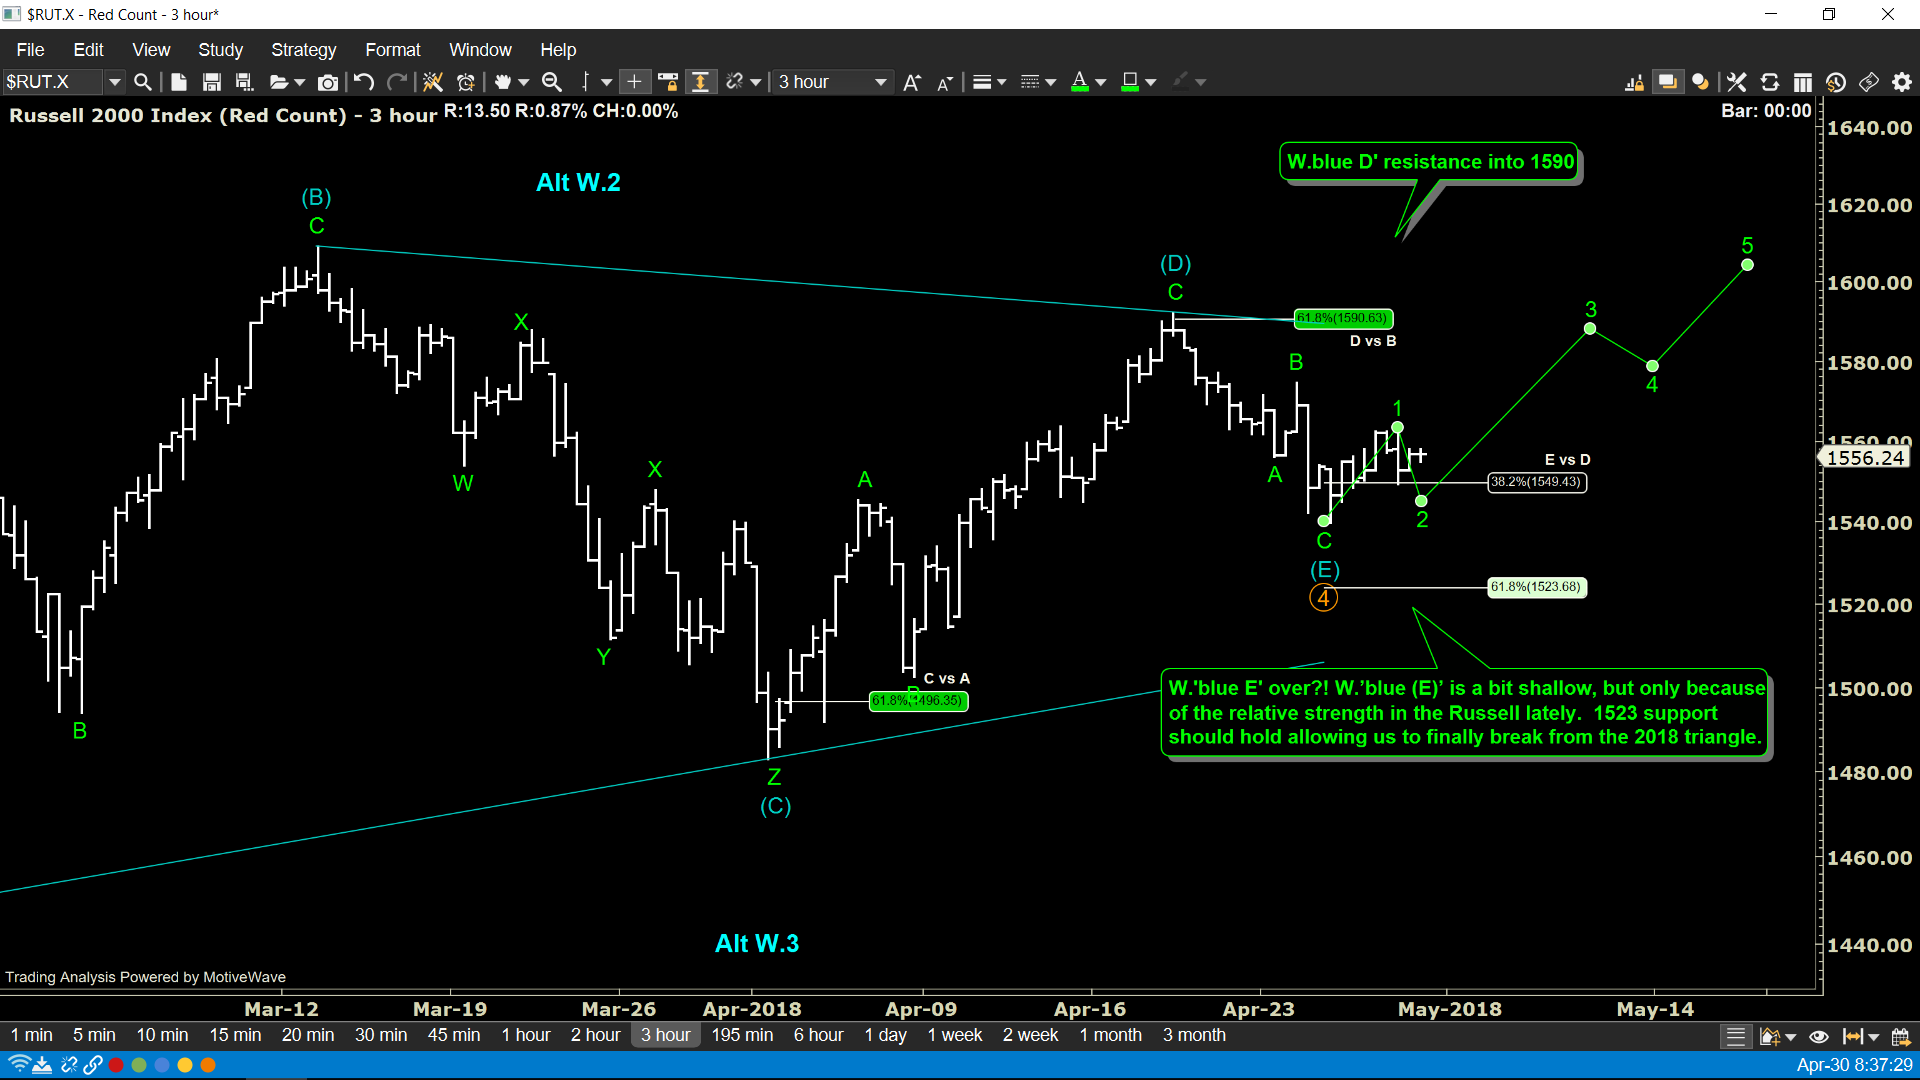
Market commentary:
April 30th - W.'blue E' over?! W.’blue (E)’ is a bit shallow, but only because of the relative strength in the Russell lately. 1523 support should hold allowing us to finally break from the 2018 triangle. April 16th - Rut showing some decent relative strength compared to the S&P and NASDAQ, but that might simply mean she’s the first to test D-wave resistance into 1565-1590. From there, a E-wave decline towards 1520 is expected. Range-bound conditions expected to persist into the summer.