[CHARTS] – US Indexes Reach Our Downside Targets!
By Bennett Tindle October 4th, 2022
Downside Targets Met!

Back in August I emailed you to let you know about the upcoming expected market pullback.
And on August 16th, markets met resistance and started the turn lower, for what I viewed to be one of the most important market decisions of the year.
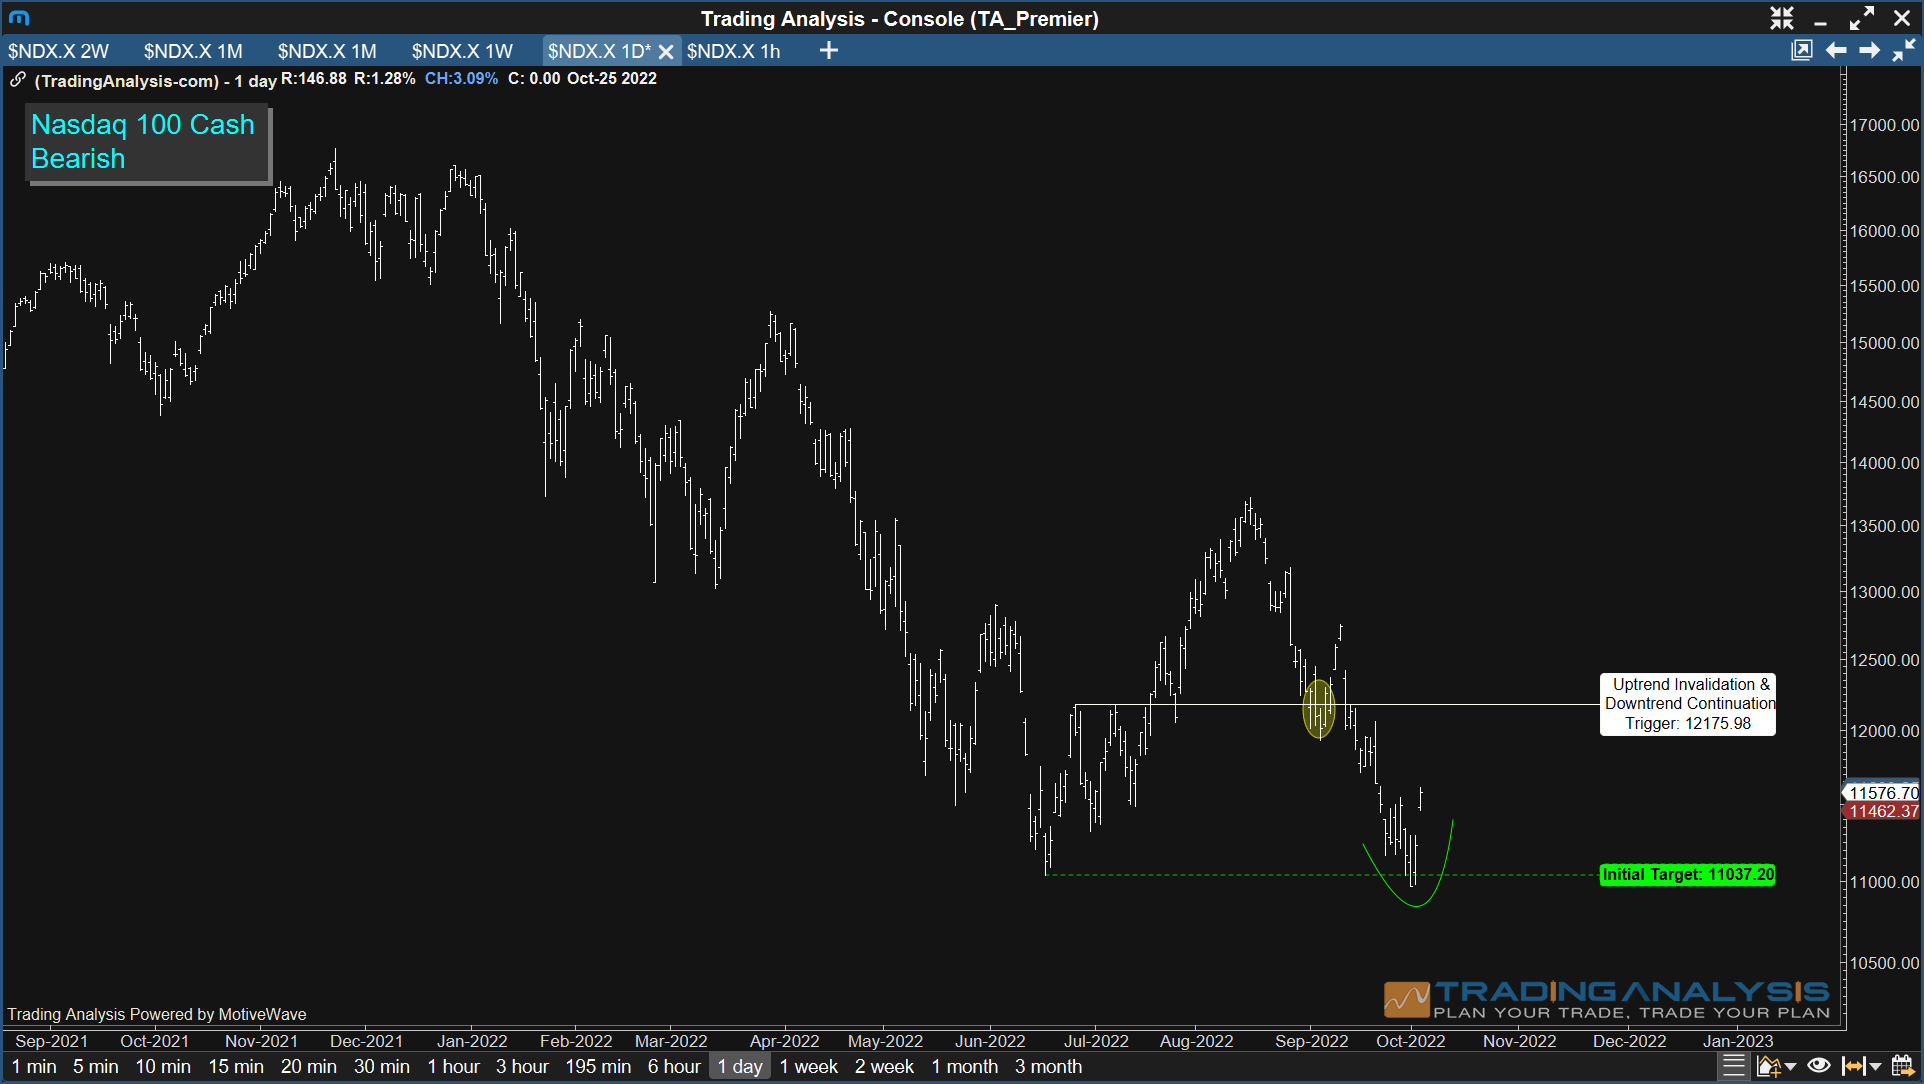
Going into the correction I brought your attention to two key levels in the S&P 500 and Nasdaq 100, and suggested a move south of those levels would confirm new index lows for the year.
For the S&P 500, it was 3945.86.
For the Nasdaq 100, it was 12,175.98.
As you can see in the charts above, both indexes have successfully established new lows for the year!
Now What?
With markets rallying today, as the dollar index and treasury yields turn lower, many are expecting this to be the start of a larger upside move.
I’m skeptical.
Don’t get me wrong, I’m open to alternate possibilities, but for now… I continue to look lower.
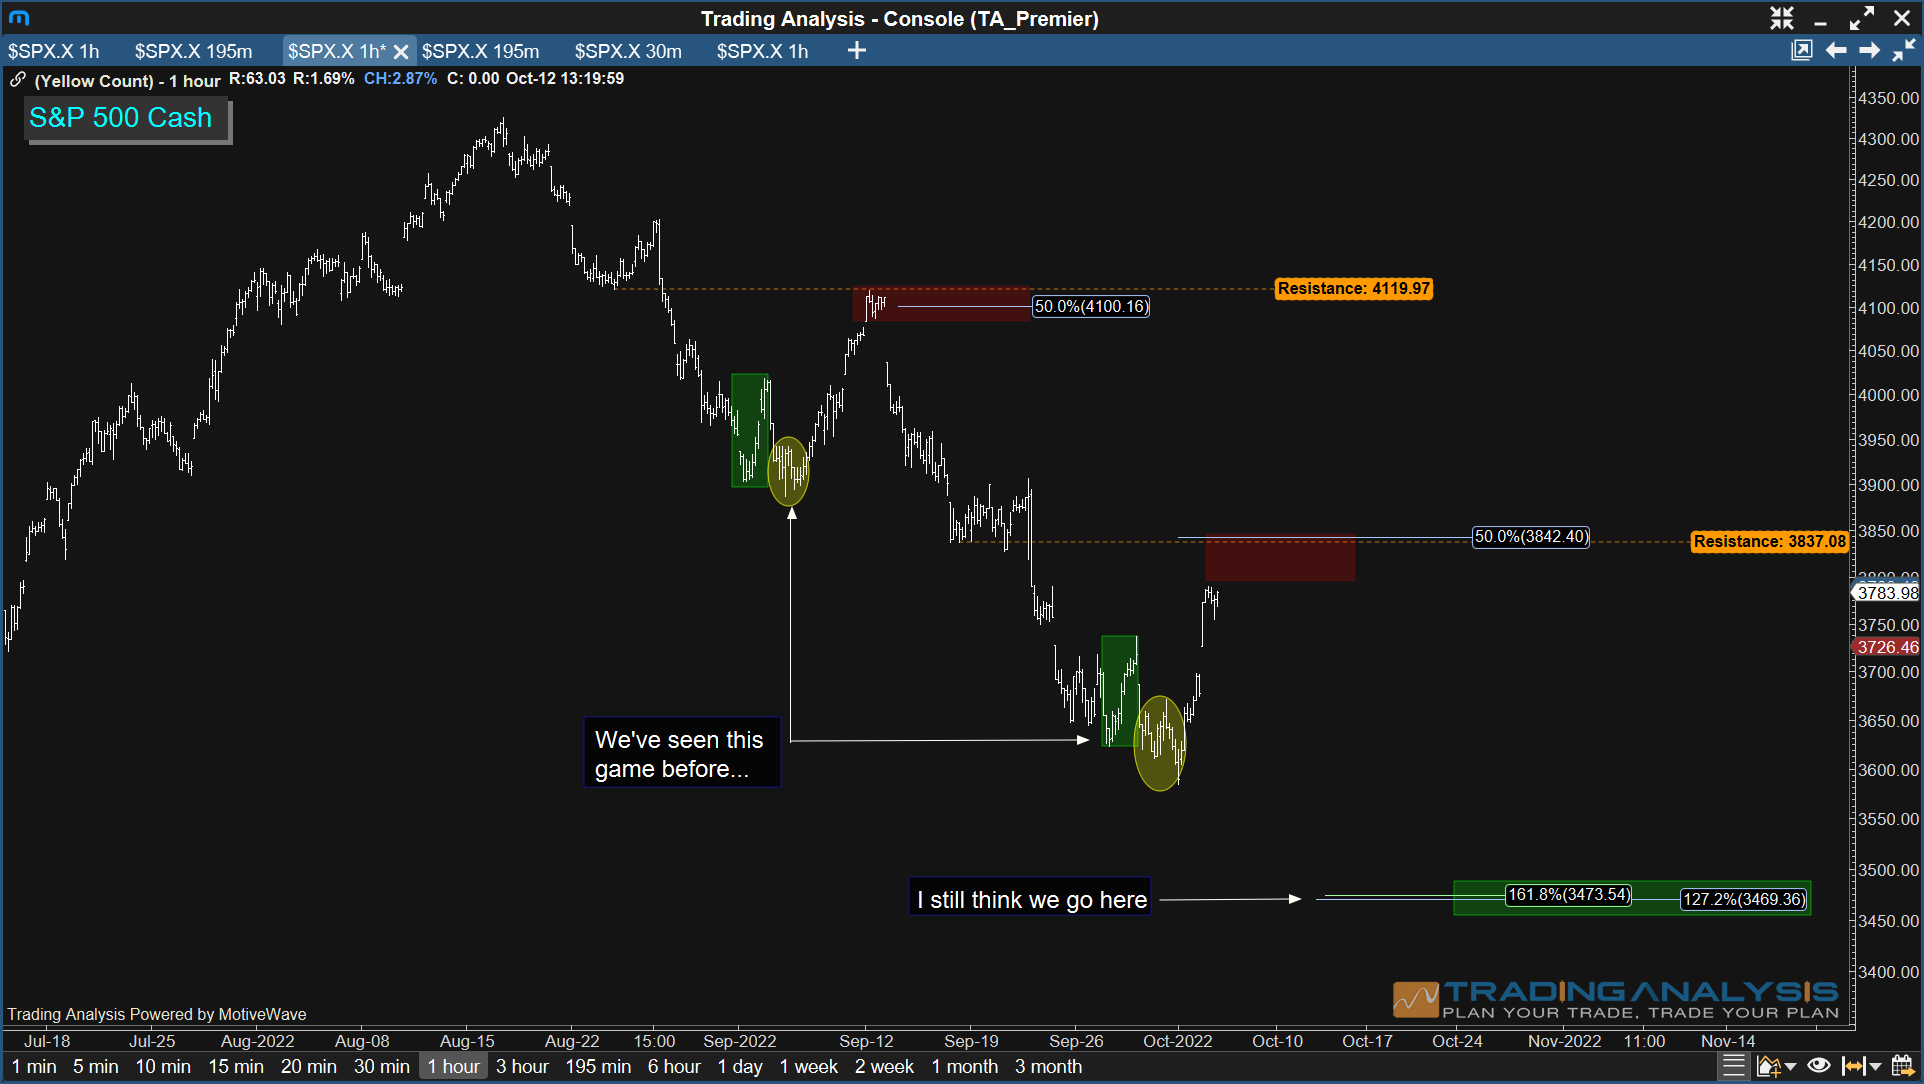
With that in mind, I wanted to take this opportunity to provide you with an update on the indexes, using the S&P 500 as our guide…
And in the chart above, you might notice the current pattern is strikingly similar to what we saw between September 1st and September 12th.
In fact, I think we are trading out the exact same pattern, and I will be looking to 3789 – 3842 resistance in the S&P 500 for answers.
If my assessment is accurate, the S&P 500 should meet resistance there and turn back to the south.
And if that proves to be the case, my next downside target will be 3469 – 3473, where we are met with a confluence of Fibonacci support.
And if my assessment is wrong, I will begin to pivot to my alternate interpretation above 3886.75.
As always, I’ll be sure to keep you updated along the way!
Regards,
-Bennett Tindle | Chief Analyst | @eWavePilot | TradingAnalysis.com
Join us Every Wednesday @ 8:45am TA Live!