Energy Top or Bullish Consolidation?
By Bennett Tindle August 10th, 2022
Crude oil is down significantly from the highs, with WTI trading under $90 for the first time since Russia invaded Ukraine in February of this year…
Many are now wondering if the top is in, which would mean relief on the inflation front…
If we believe what the hard-right-edge of the chart is telling us, then we need to remain bullish Crude.
However the current momentum fade in Energy from a position of significant outperformance is strikingly similar to what we saw in August of 2011.
In fact, although the Energy sector eventually moved higher into 2013 and 2014 before the larger decline, the momentum fade marked the top of the Crude market in 2011…
It took Crude over a decade to reclaim those levels.
With investors seeking signs of peak inflation, this discussion is more important now than ever before.
So join me as I take you through a historical comparison of current conditions compared to 2011, and join us live tomorrow morning for more information on the topic!
Monthly RRG 2022
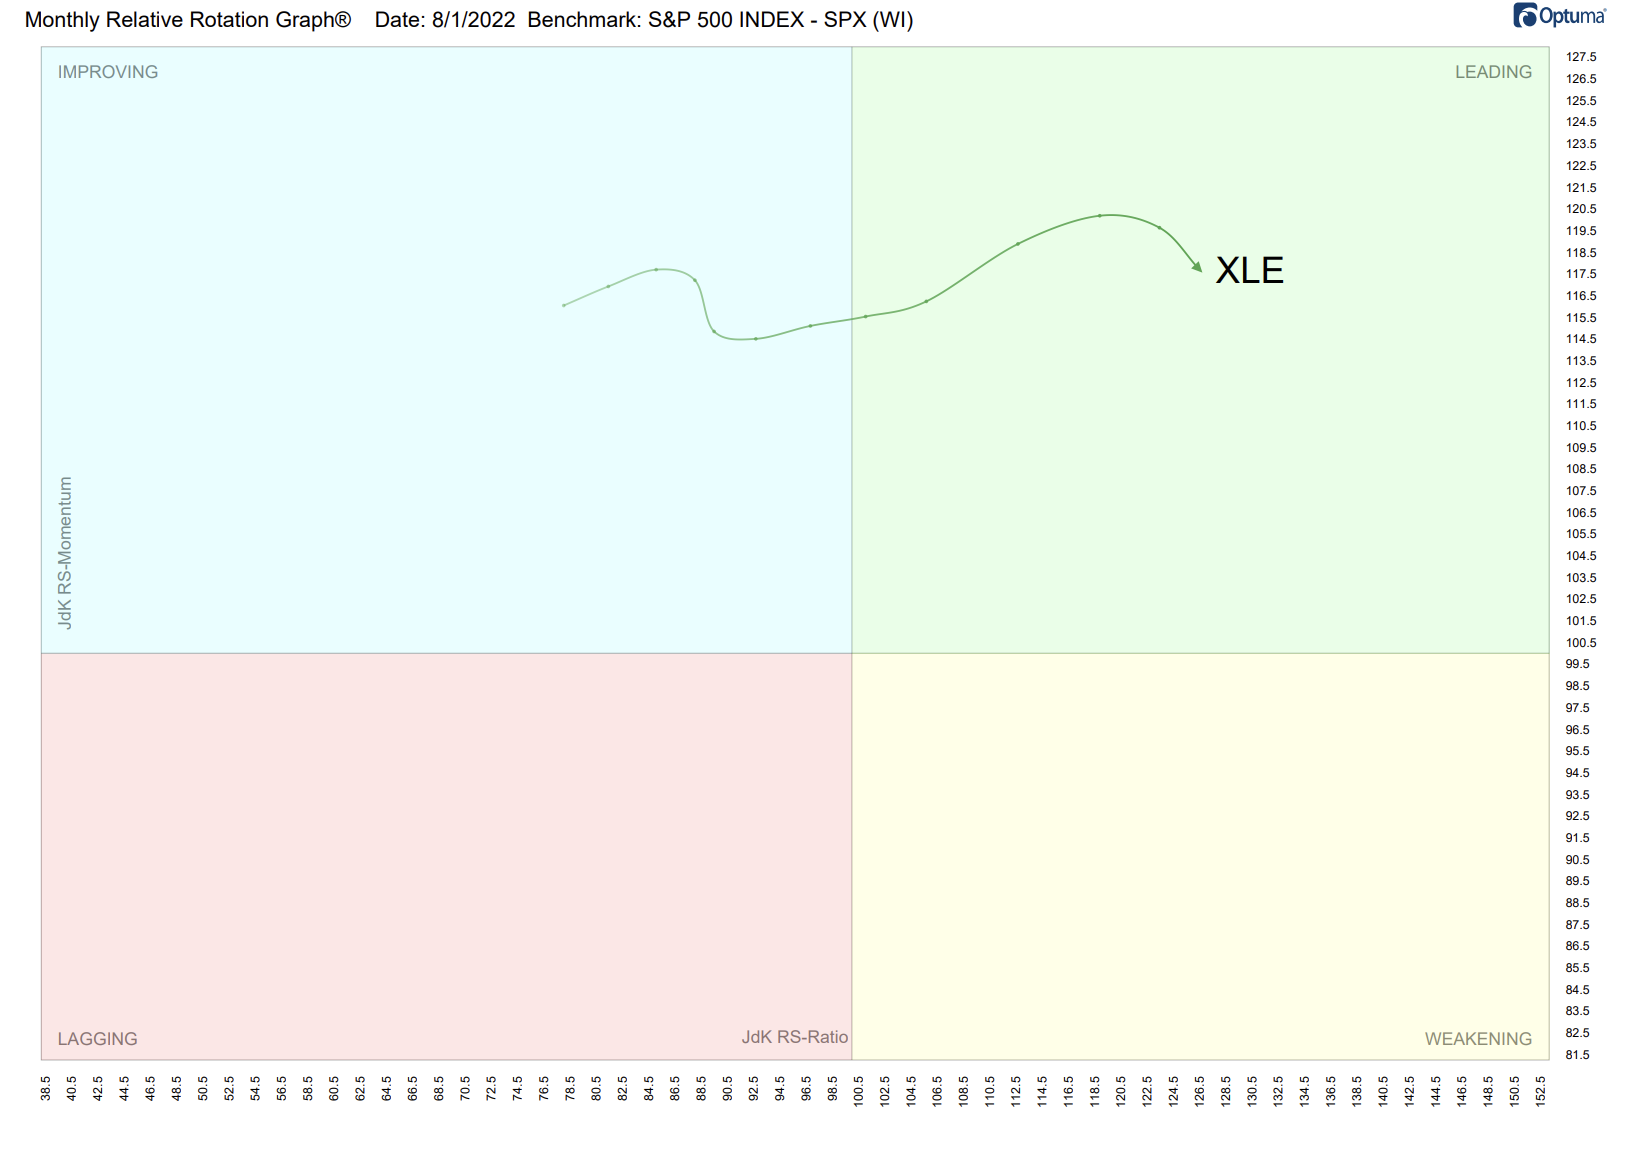
In the chart above we can see the current monthly RRG chart, a visual representation of strength and momentum relative to a benchmark, which in this case is the S&P 500.
On the monthly RRG chart, Energy currently sports the highest relative strength ratio.
Although the sector is continuing to gain relative strength, the momentum is beginning to fade, which is evident based on the hook towards the south.
In the next chart, we look back to the last time Energy demonstrated such significant outperformance relative to the S&P 500 on the monthly timeframe.
Monthly RRG 2011

Between July of 2010 and April of 2011, the Energy sector rallied better than +67%. This was the last period of significant outperformance on the monthly rotation, and conditions are very similar to where we stand today.
While the Energy sector traded above the April 2011 high between the the Summer of 2013 and 2014, the more dominant trend that materialized was to the downside.
Crude on the other hand went mostly sideways, and only revisited its April 2011 high in March of this year!
WEEKLY RRG 2022
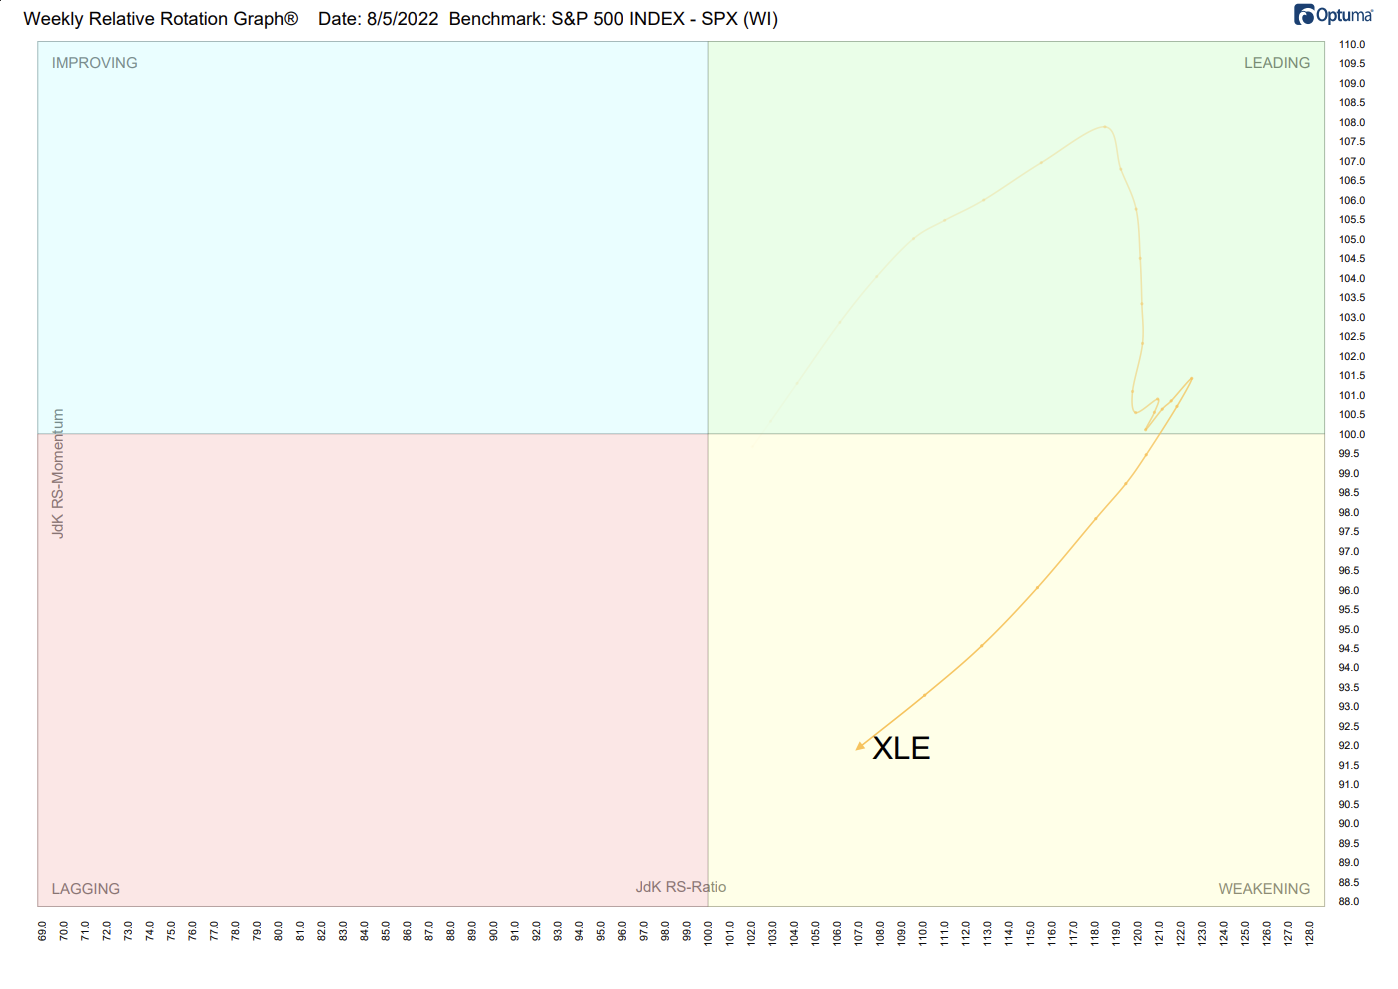
We now move lower in the timeframe scale on the RRG charts, and review the current conditions on the weekly RRG.
Here we can see the Energy sector sporting a “yellow” tail, indicating weakening conditions.
As this hook to the southwest unfolded, the Energy sector and WTI Crude Oil declined around 30%.
Weekly RRG 2011
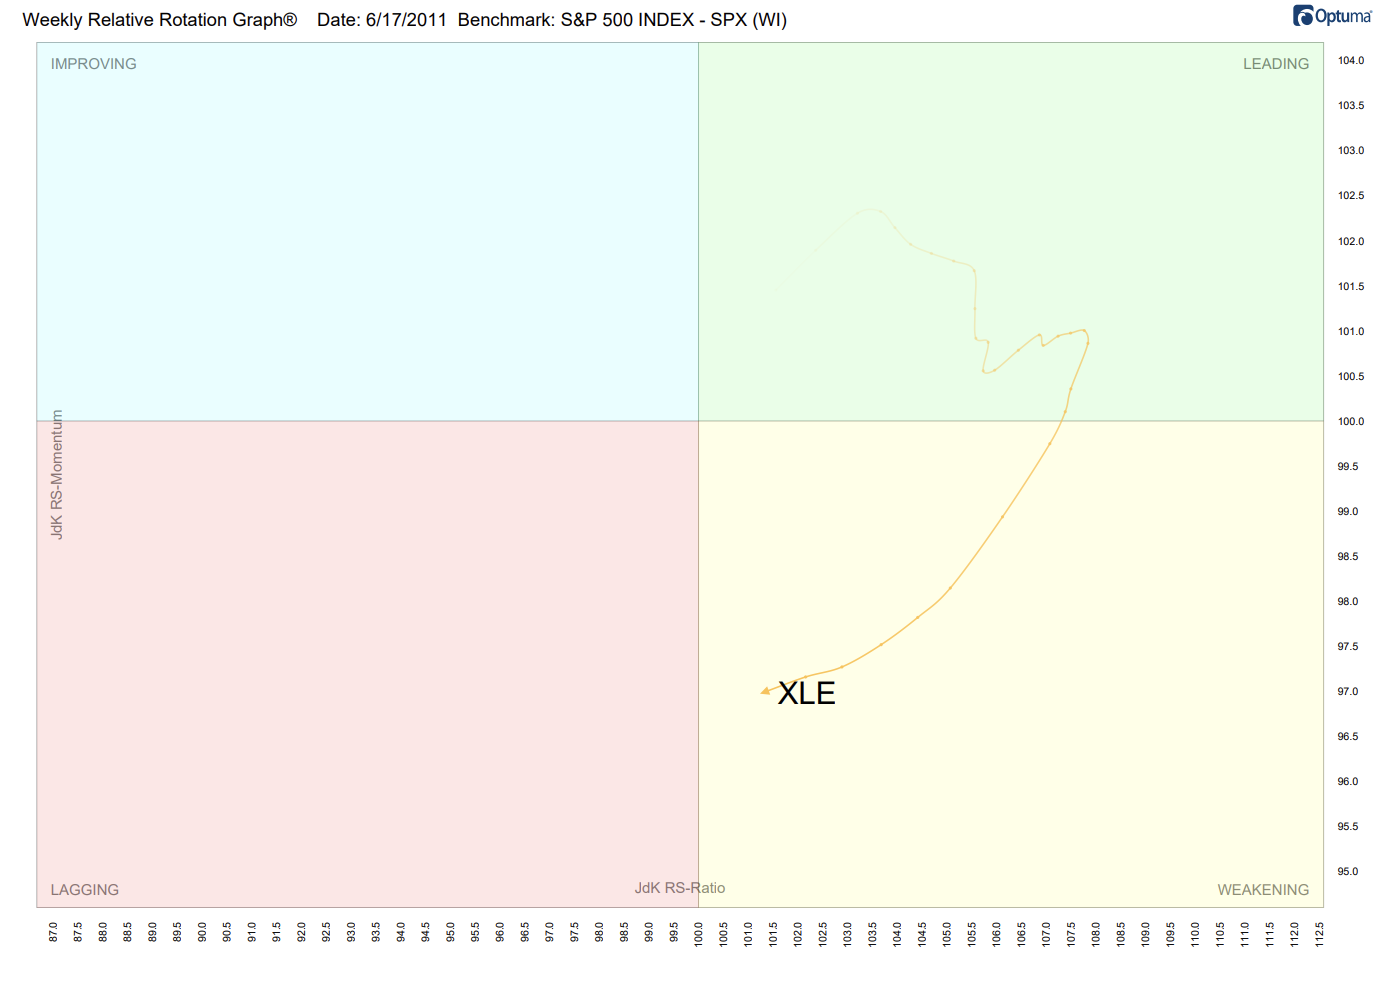
Looking back to the Summer of 2011, we see conditions on the weekly were very similar to where they stand now.
Energy had been trading higher in a period of significant outperformance, but a hook back to the south resulted in a rapid loss of both relative strength and momentum…
This marked the top of the Crude market for more than a decade.
In Conclusion
Now, don’t get me wrong. I said in the beginning that if we believe what the hard-right-edge of the chart is telling us, then we need to REMAIN BULLISH Crude Oil and the Energy Sector.
Then again, if this historical comparison is of any significance, then we need to pay attention to what it might be telling us about the sector…
Is the commodity trade top in, and have we truly seen a peak in inflation?
If we believe what the rotation has to say, then yes. It is entirely possible the $130 handle WTI Crude high in March marks a significant top…
Yet the move does not look to be the start of a trend-establishing decline.
Instead it looks to be bullish sideways consolidation setting up for another rally in Energy…
To bring this discussion full circle, we now look to the weekly chart of WTI Crude Oil below…
WTI Crude Oil Weekly Chart
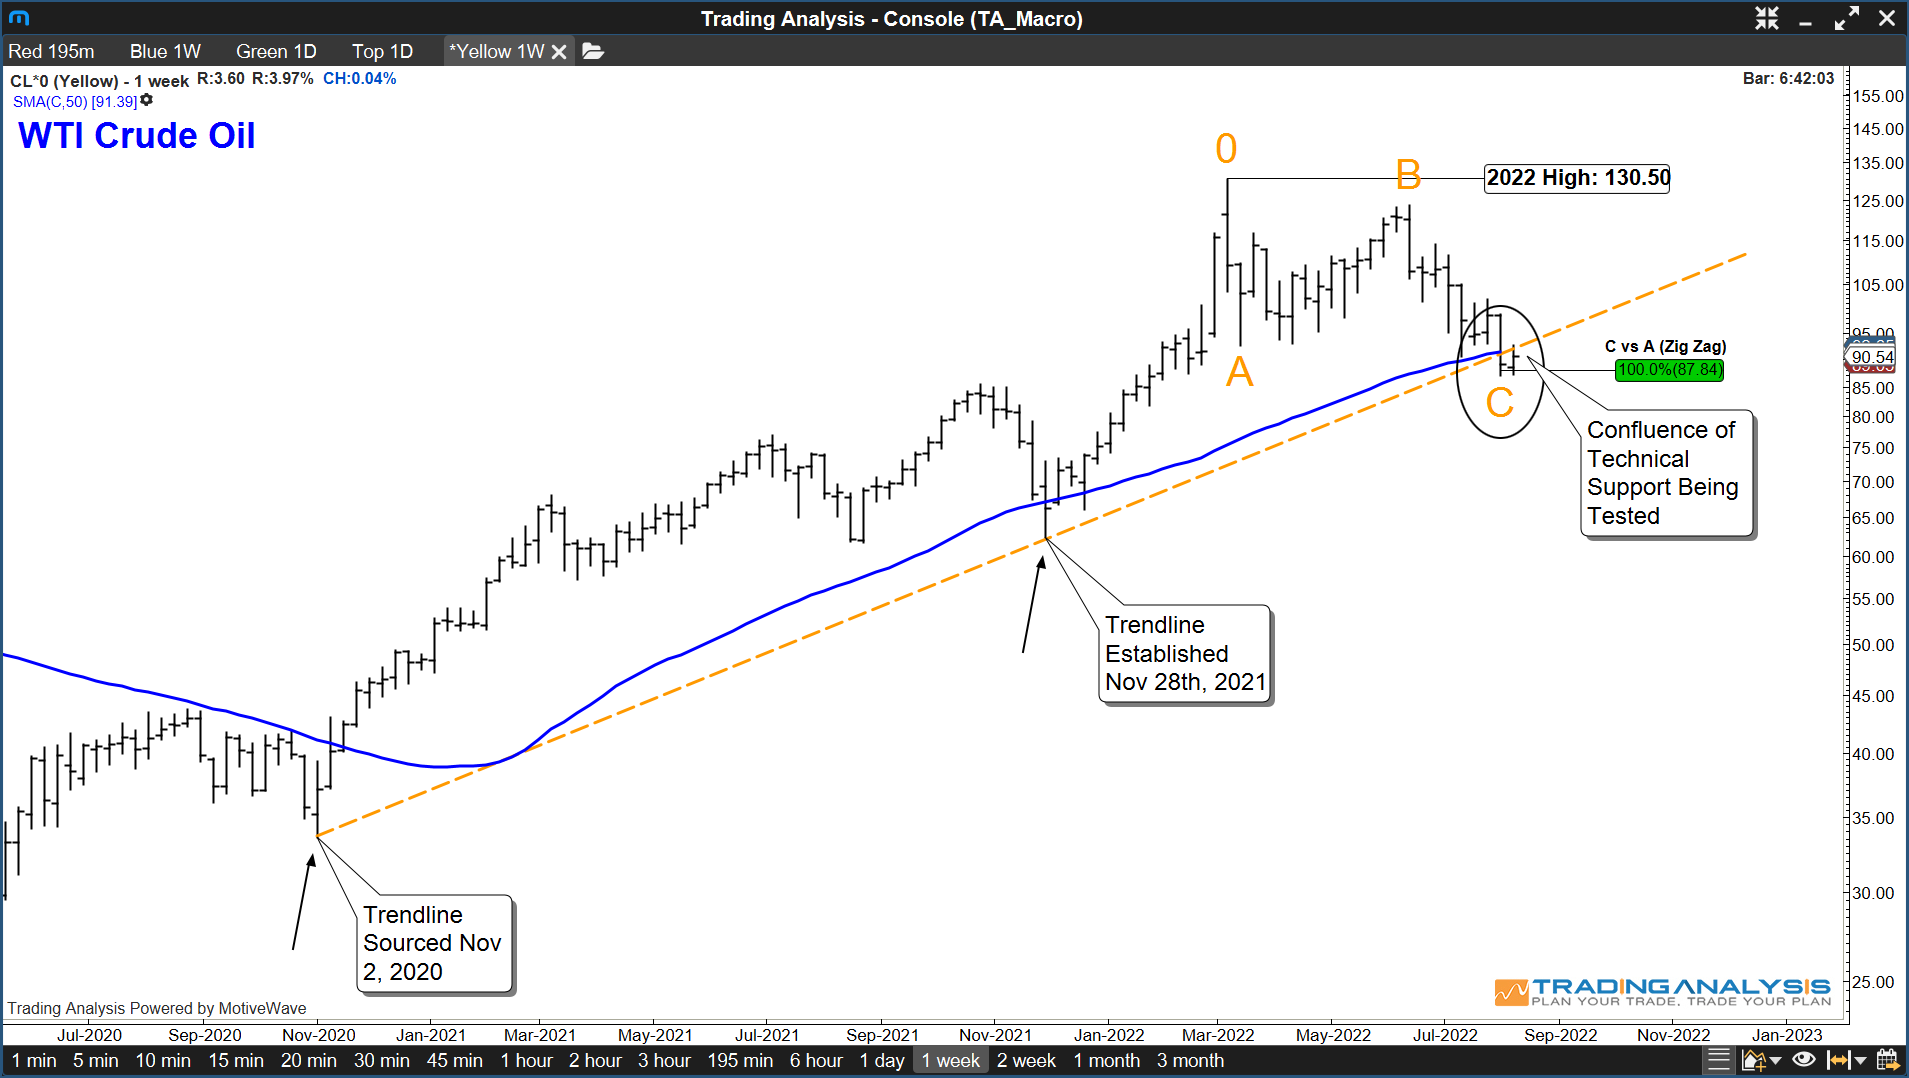
Here we see a confluence of traditional technical support, which includes the Weekly 50 period moving average, Trendline Support, and a ‘Measured Move‘ Fibonacci projection near $87.
If the hard-right-edge of the chart is right, then we should see Energy begin to round out a low near $87 and continue higher.
Alternatively, if the above confluence of technical support is breached to the downside, then this may prove to be a much more significant top.
As stated above, given the corrective nature in which Crude Oil has been trading off the March high, I continue to remain bullish and expect support to hold.
If I’m wrong, a break of noted support will be sign #1 that a more significant top is in.
Given the current economic conditions, I think you can all appreciate the significance of this discussion and the implications it could have on the inflation front.
See you on the next one!
Regards,
Bennett Tindle | Chief Analyst | TradingAnalysis.com | @eWavePilot
P.S: We’ve used historical RRG comparisons in the past with success, most recently to identify a rotation out of Value stocks and sectors going into 2022. Generally we find our hard-right-edge discretionary analysis aligns well with any RRG comparisons we present, but this time is different. This time the rotation suggests a major top may be in, where the chart suggests we hold support and continue higher from here. Given the current state of inflation, we wanted you to be prepared for both possibilities.
Join us Every Wednesday @ 8:45am TA Live!