Support In Precious Metals?
By Bennett Tindle July 26th, 2022
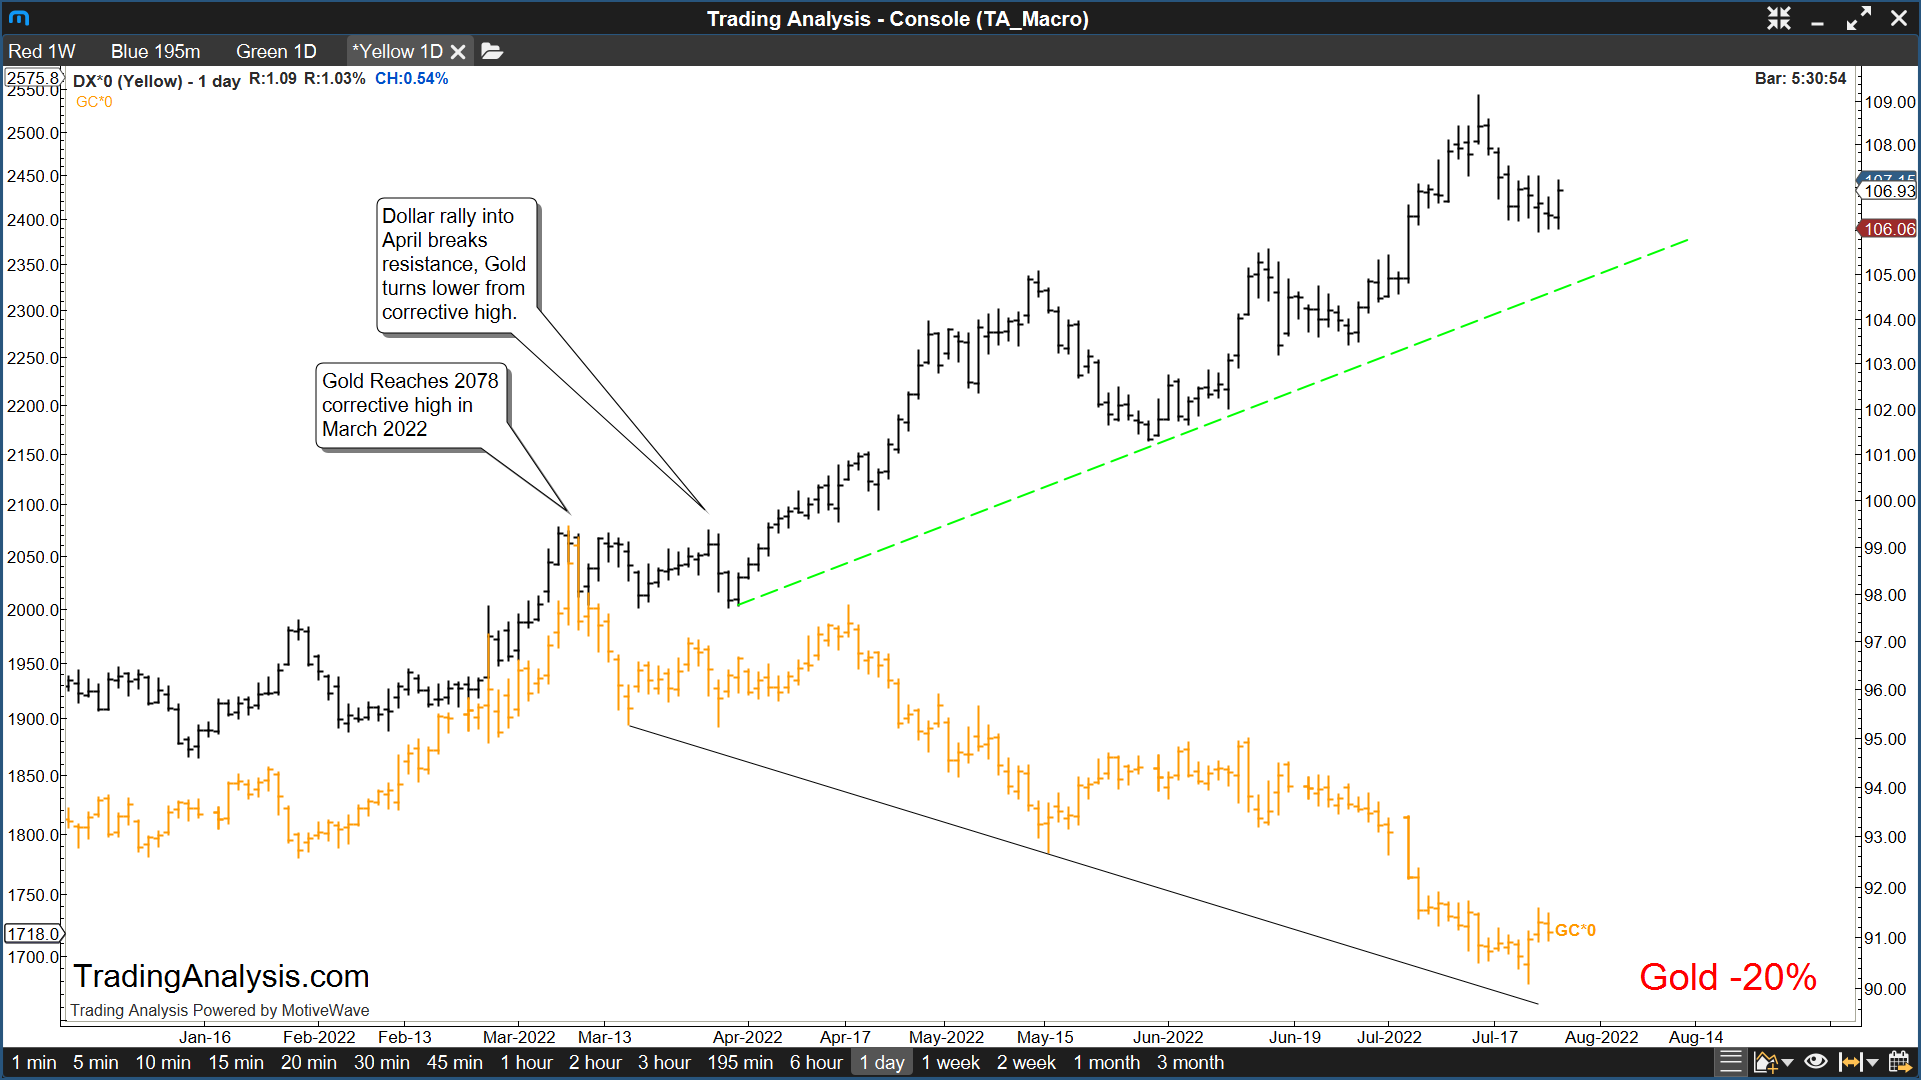
Gold fever set in earlier in the year as equity markets were under pressure, with Gold setting a 2078 handle high back in March.
Everyone expected the breakout to continue, turning to precious metals as an “inflation hedge”, but the Dollar held consolidation into April and broke sharply higher above resistance.
Below you can see where the divergence occurred, and we’ve since seen a near -20% decline in the Gold.
You might be thinking, with such a significant breakout from the dollar, how can we be looking for a potential bullish pivot in precious metals?
Taking a step back to the weekly and monthly timeframes, we can see the dollar meeting key technical resistance, and likely nearing the end of a cycle, just as Gold is meeting major downside support.
Below we see the monthly view of Gold futures, with major support offered from our base trend channel going back to 2015, as well as a confluence of Fibonacci support levels, which include 1672, 1659 and 1578.
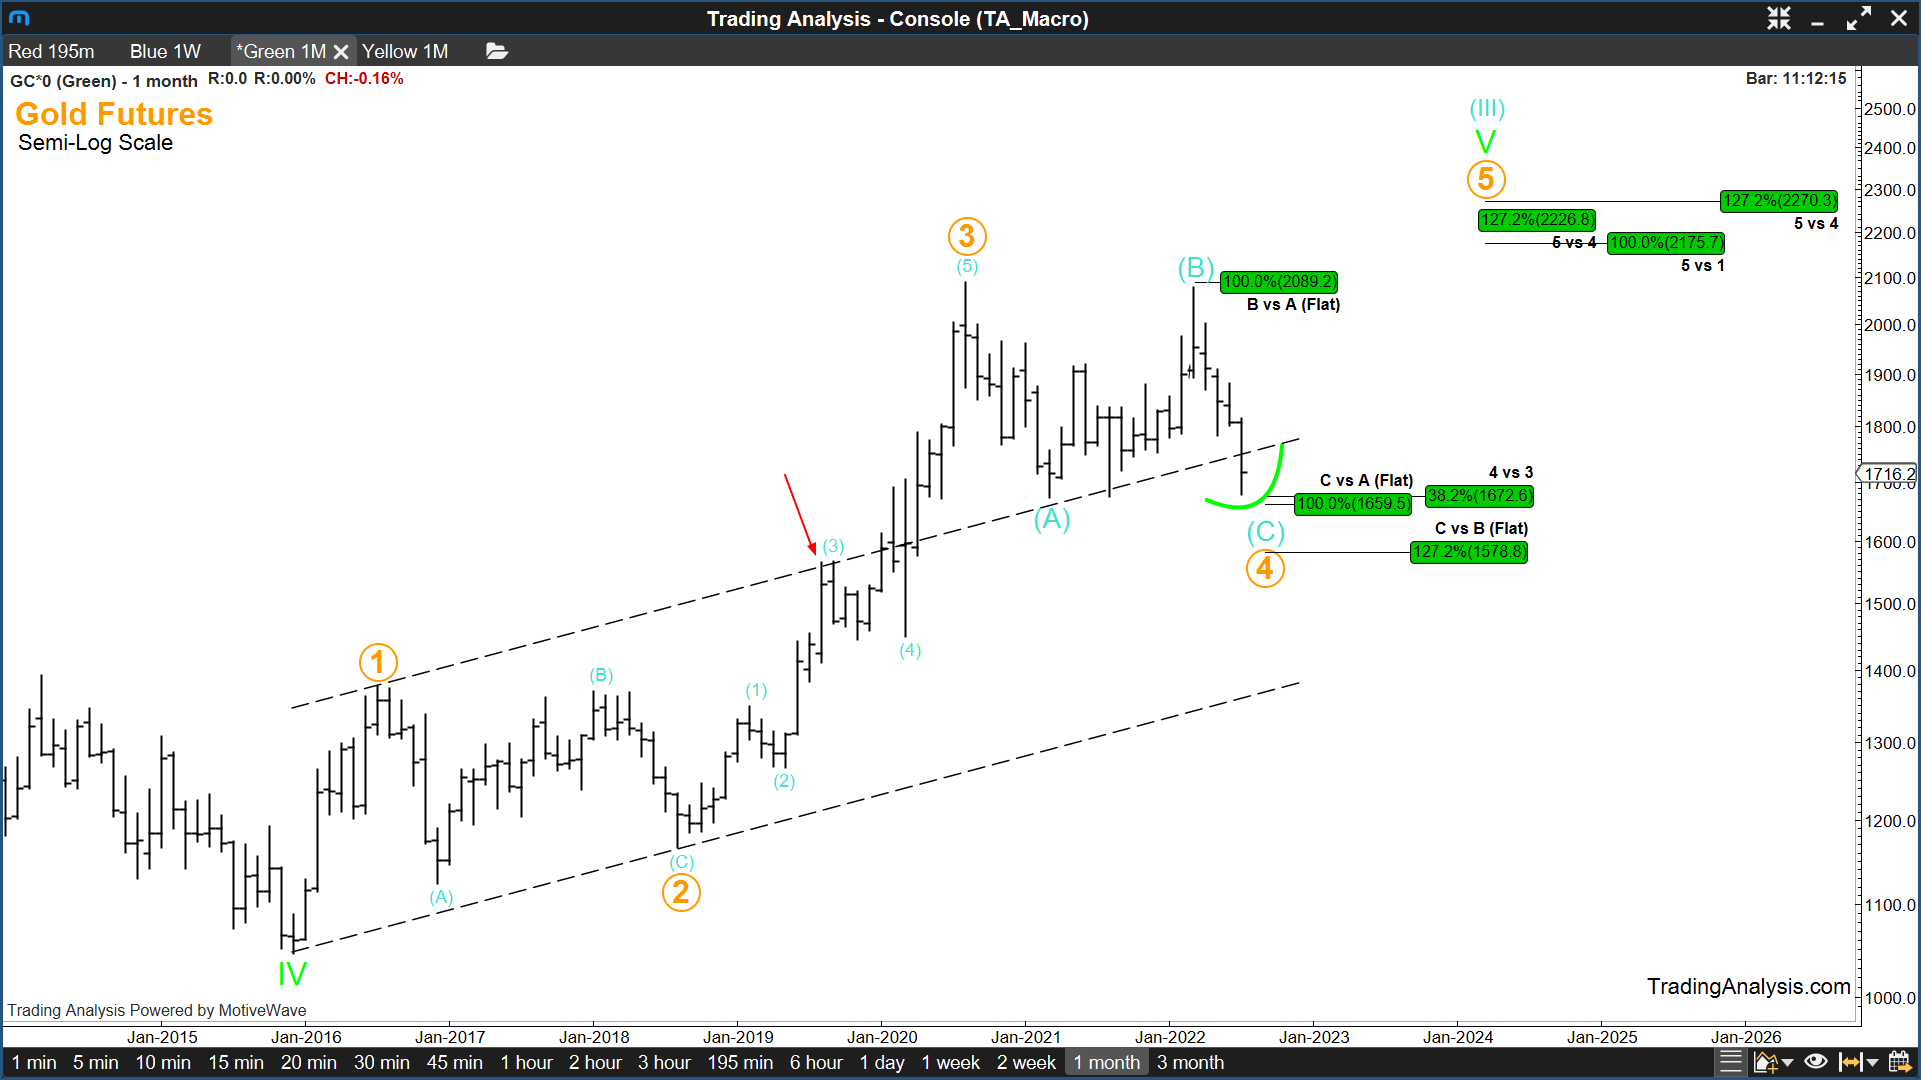
As you can see above, the rally to 2078 in March was what we call in the world of Elliott Wave a “corrective” rally, meaning the more dominant trend is still down from the August 2020 highs… but that corrective trend looks to be nearing completion.
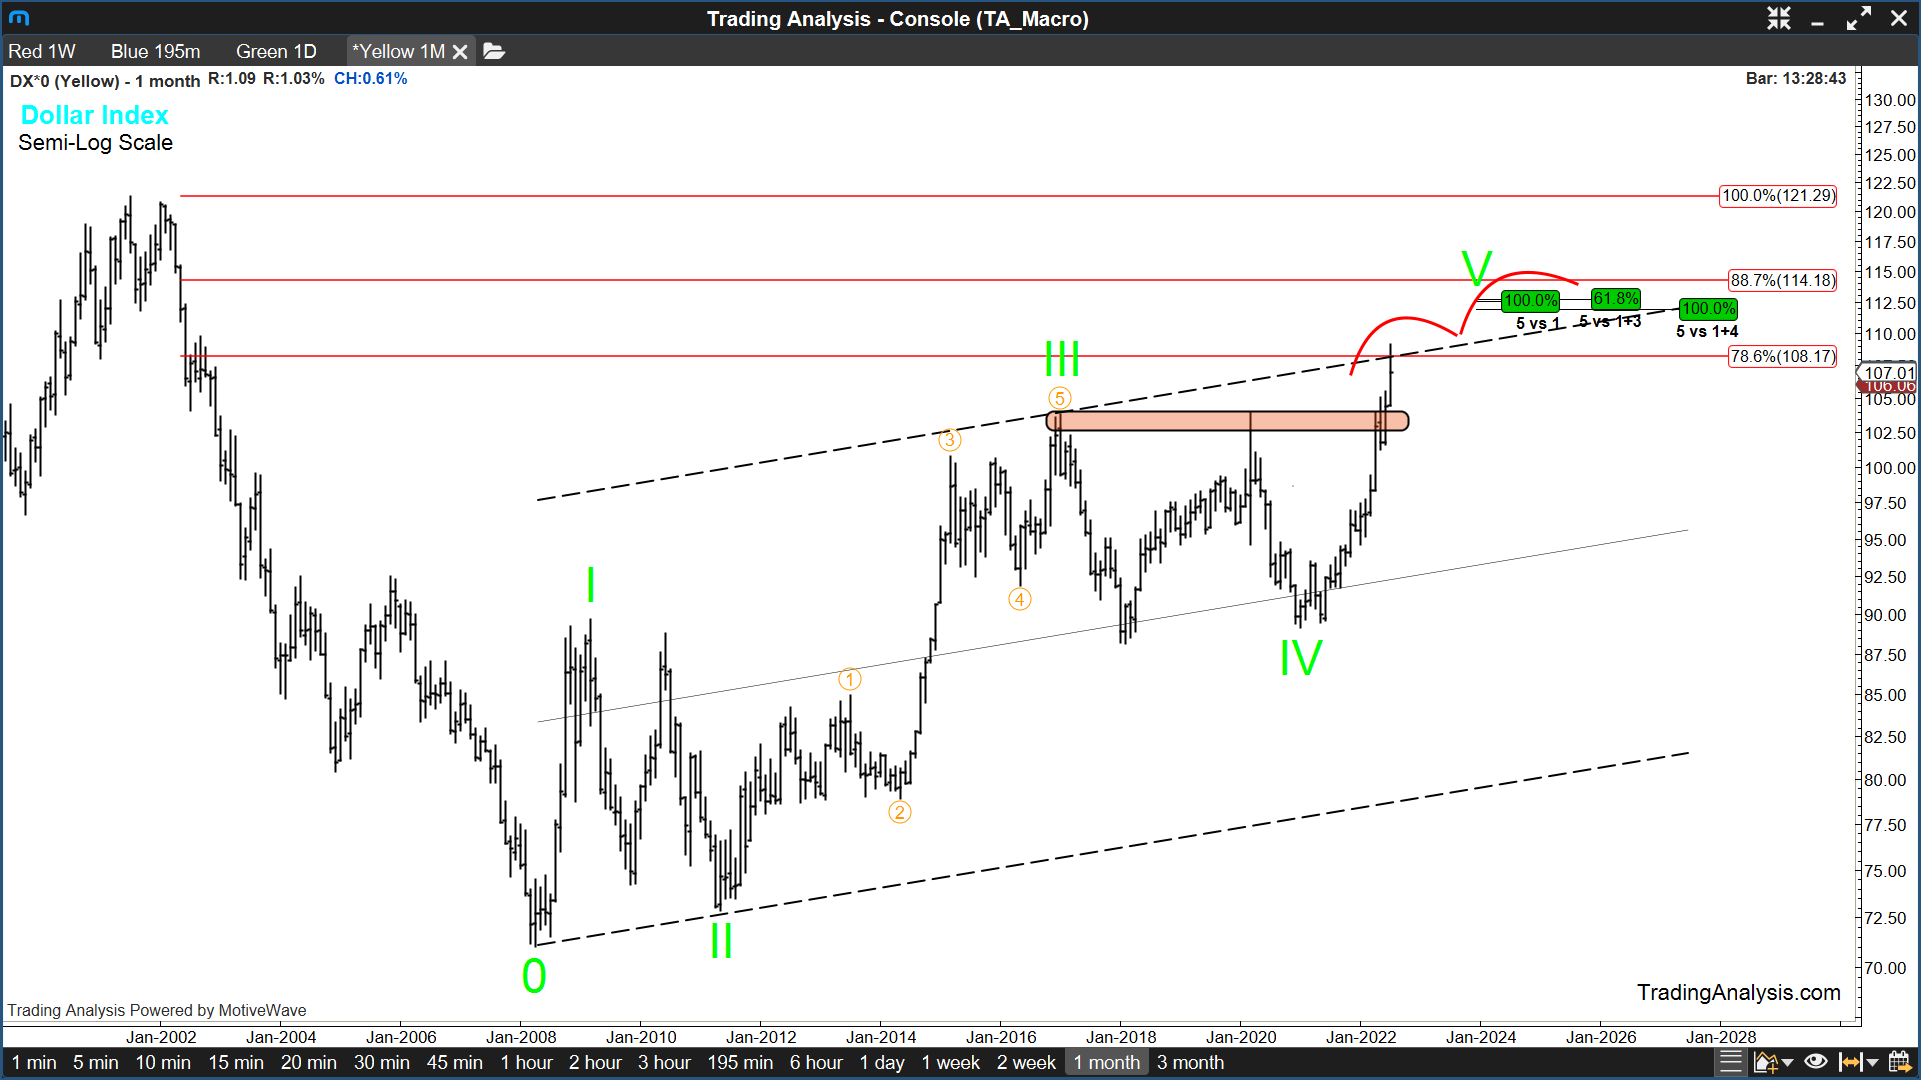
Now we need to consider the chart of the Dollar Index, also know as the ‘DXY’.
In the monthly chart of the dollar below, although we’ve seen a significant breakout above key technical resistance from Jan of 2017 and March of 2020, we are just now meeting base channel resistance above the 78.6% retracement of the decline from the 2001 highs.
Not to mention we are approaching what should be a completed 5-wave rally from the 2008 dollar low…
Now don’t take this analysis the wrong way…
Because the dollar chart still implies upside to 112 is possible…
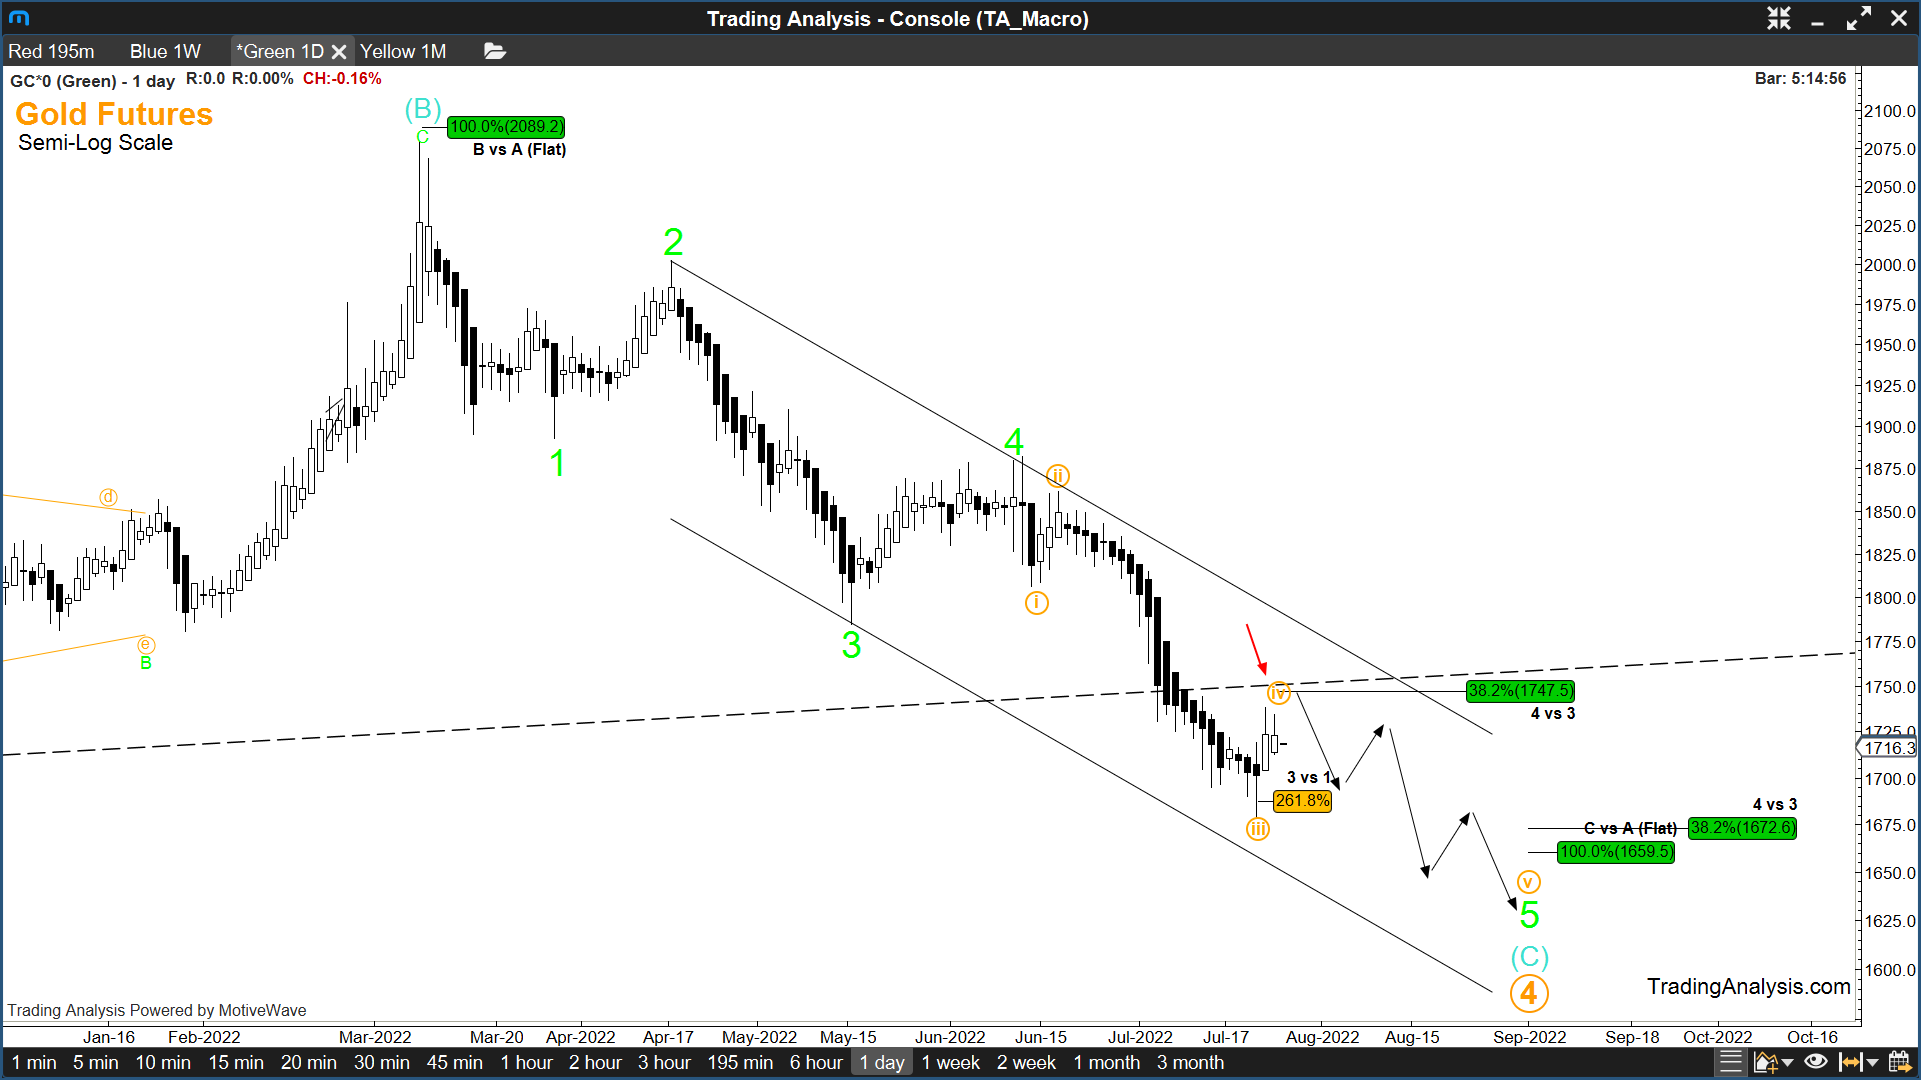
And as you will see below in the daily chart of Gold, we also expect 1745 resistance could yield another selloff to 1672 or 1659 support…
And if the dollar accelerates above the 78.6% and channel resistance, Gold could technically visit the more significant downside Fib target discussed above in the monthly chart at 1578…
But remember, the best trades are planned in advance. In fact, that is our company motto… Plan your trade, trade your plan. So although this pivot might not be immediate, the setup is certainly valid.
Click to Watch Full Video Update Now
At TradingAnalysis.com, we believe in putting our money where our mouth is.
We suspected the 2078 high in March was a corrective rally, and awaited a confirming development before going to work.
Gold rallied from March 29 – April 18th, and the very next day we went SHORT, picking up a small PUT spread in $GDX
Join us Every Wednesday @ 8:45am TA Live!